9.2.2C Graphs of Non-Linear Functions
Sketch the graphs of common non-linear functions such as f(x)=$\sqrt{x}$, f(x)=$\left | x \right |$, f(x)=$\frac{1}{x}$, f(x)=$x^{3}$, and translations of these functions, such as f(x)=$\sqrt{x-2}+4$. Know how to use graphing technology to graph these functions.
Overview
Standard 9.2.2 Essential Understandings
Mathematical modeling is a process that allows students to describe and make sense of the relationship between an independent variable and a dependent variable found in a real-world setting. This standard specifies that high school students should be able to model situations using a variety of functions that include linear, quadratic, exponential, absolute value, inverse, power, square root, and other common functions. Students need to be able to fluidly translate among tables, graphs, and equations of these functions in order to match key features of these functions to real-world situations. The key features that separate these function types include intercepts, asymptotes, restricted domain, and rate of change. As students learn to make connections between the representations of the models and the real-world situation they begin to understand how variables in their life are connected to the mathematics they study in school as well as extend their knowledge of function types themselves.
All Standard Benchmarks
9.2.2.1
Represent and solve problems in various contexts using linear and quadratic functions.
For example: Write a function that represents the area of a rectangular garden that can be surrounded with 32 feet of fencing, and use the function to determine the possible dimensions of such a garden if the area must be at least 50 square feet.
9.2.2.2
Represent and solve problems in various contexts using exponential functions, such as investment growth, depreciation and population growth.
9.2.2.3
Sketch graphs of linear, quadratic and exponential functions, and translate between graphs, tables and symbolic representations. Know how to use graphing technology to graph these functions.
9.2.2.4
Express the terms in a geometric sequence recursively and by giving an explicit (closed form) formula, and express the partial sums of a geometric series recursively.
For example: A closed form formula for the terms tn in the geometric sequence 3, 6, 12, 24, ... is tn = 3(2)n-1, where n = 1, 2, 3, ... , and this sequence can be expressed recursively by writing t1 = 3 and tn = 2tn-1,for n ≥ 2.
Another example: the partial sums sn of the series 3 + 6 + 12 + 24 + ... can be expressed recursively by writing s1 = 3 and sn = 3 + 2sn-1,for n ≥ 2.
9.2.2.5
Recognize and solve problems that can be modeled using finite geometric sequences and series, such as home mortgage and other compound interest examples. Know how to use spreadsheets and calculators to explore geometric sequences and series in various contexts.
9.2.2.6
Sketch the graphs of common non-linear functions such as $f\left ( x \right )=\sqrt{x}$, $f\left ( x \right )=\left |x\right |$, $f\left ( x \right )=\frac{1}{x}$, $f\left ( x \right )=x^{3}$, and translations of these functions, such as $f\left ( x \right )=\sqrt{x-2}+4$. Know how to use graphing technology to graph these functions.
Benchmark Group C
9.2.2.6
Sketch the graphs of common non-linear functions such as $f\left ( x \right )=\sqrt{x}$, $f\left ( x \right )=\left |x\right |$, $f\left ( x \right )=\frac{1}{x}$, $f\left ( x \right )=x^{3}$, and translations of these functions, such as $f\left ( x \right )=\sqrt{x-2}+4$. Know how to use graphing technology to graph these functions.
What students should know and be able to do [at a mastery level] related to these benchmarks
- Students should be able to calculate a table of ordered pairs that match common non-liner functions and plot those points on a graph. They should be flexible in their choice of numbers for the input variable so they can find important points on the graph.
- Eventually students should be able to know key features of common non-linear functions so the graphs can be sketched accurately without plotting several points. For example, students should know that the function $f\left ( x \right )=\frac{1}{x}$ is a hyperbola that has both a horizontal (x-axis) and vertical asymptote (y-axis). They should be able to sketch the curves in quadrants I and III quickly and use a couple of calculated points if more precision is needed.
- Students should know that the graph of the function $g\left ( x \right )=f\left ( x-k \right )+c$ is the same shape as the parent function $f\left ( x \right )$ but is translated vertically by $c$ units and translated horizontally by $k$ units.
- Students should be able to enter a function $f\left ( x \right )$ into a graphing utility as well as a translation of that function $g\left ( x \right )=f\left ( x-k \right )+c$ simultaneously to compare the change in the graphs.
Work from previous grades that supports this new learning includes:
- Students should be able to evaluate expressions involving square roots, absolute value, inverse, and xn where n is an integer. Students should be able to evaluate any of these expressions using any rational number.
Correlations
NCTM Standards: (those that apply to 9.2.2 are bolded)
(p.296, PSSM) Instructional programs from Pre-K through grade 12 should enable all students to
Understand patterns, relations, and functions. In grades 9-12 all students should
- generalize patterns using explicitly defined and recursively defined functions;
- understand relations and functions and select, convert flexibly among, and use various representations for them;
- analyze functions of one variable by investigating rates of change, intercepts, zeros, asymptotes, and local and global behavior;
- understand and perform transformations such as arithmetically combining, composing, and inverting commonly used functions, using technology to perform such operations on more-complicated symbolic expressions;
- understand and compare the properties of classes of functions, including exponential, polynomial, rational, logarithmic, and periodic functions;
- interpret representations of functions of two variables.
Represent and analyze mathematical situations and structures using algebraic symbols. In grades 9-12 all students should
- understand the meaning of equivalent forms of expressions, equations, inequalities, and relations;
- write equivalent forms of equations, inequalities, and systems of equations and solve them with fluency - mentally or with paper and pencil in simple cases and using technology in all cases;
- use symbolic algebra to represent and explain mathematical relationships;
- use a variety of symbolic representations, including recursive and parametric equations, for functions and relations;
- judge the meaning, utility, and reasonableness of the results of symbol manipulations, including those carried out by technology.
Use mathematical models to represent and understand quantitative relationships. In grades 9-12 all students should
- identify essential quantitative relationships in a situation and determine the class or classes of functions that might model the relationships;
- use symbolic expressions, including iterative and recursive forms, to represent relationships arising from various contexts;
- draw reasonable conclusions about a situation being modeled.
Analyze change in various contexts. In grades 9-12 all students should
- approximate and interpret rates of change from graphical and numerical data.
Common Core State Standards (CCSM)
High School: Functions:
Interpret functions that arise in applications in terms of the context.
· F-IF.4. For a function that models a relationship between two quantities, interpret key features of graphs and tables in terms of the quantities, and sketch graphs showing key features given a verbal description of the relationship. Key features include: intercepts; intervals where the function is increasing, decreasing, positive, or negative; relative maximums and minimums; symmetries; end behavior; and periodicity.★
· F-IF.5. Relate the domain of a function to its graph and, where applicable, to the quantitative relationship it describes. For example, if the function h(n) gives the number of person-hours it takes to assemble n engines in a factory, then the positive integers would be an appropriate domain for the function.★
· F-IF.6. Calculate and interpret the average rate of change of a function (presented symbolically or as a table) over a specified interval. Estimate the rate of change from a graph.
Analyze functions using different representations.
· F-IF.7. Graph functions expressed symbolically and show key features of the graph, by hand in simple cases and using technology for more complicated cases.★
- Graph linear and quadratic functions and show intercepts, maxima, and minima.
- Graph square root, cube root, and piecewise-defined functions, including step functions and absolute value functions.
- Graph polynomial functions, identifying zeros when suitable factorizations are available, and showing end behavior.
- (+) Graph rational functions, identifying zeros and asymptotes when suitable factorizations are available, and showing end behavior.
- Graph exponential and logarithmic functions, showing intercepts and end behavior, and trigonometric functions, showing period, midline, and amplitude.
· F-IF.8. Write a function defined by an expression in different but equivalent forms to reveal and explain different properties of the function.
- Use the process of factoring and completing the square in a quadratic function to show zeros, extreme values, and symmetry of the graph, and interpret these in terms of a context.
- Use the properties of exponents to interpret expressions for exponential functions. For example, identify percent rate of change in functions such as $y=(1.02)^{t}$, $y=(0.97)^{t}$, $y=(1.01)^{12t}$, $y=(1.2)^{\frac{t}{10}}$, and classify them as representing exponential growth or decay.
· F-IF.9. Compare properties of two functions each represented in a different way (algebraically, graphically, numerically in tables, or by verbal descriptions). For example, given a graph of one quadratic function and an algebraic expression for another, say which has the larger maximum.
Misconceptions
Student Misconceptions and Common Errors
- Students will calculate too small a set of point to graph a function. For example, a student asked to graph y = |x - 5| will correctly calculate the ordered pairs (0,5), (1,4), and (2,3) and incorrectly graph a line passing through the points.
- Students do not use the correct syntax when entering a function into a graphing utility. Students who are trying to graph $y=\frac{1}{x-3}$ often enter $1/x-3$, which results in a graph of a different function $y=\frac{1}{x}=3$.
Vignette
Chunkette:
In the Classroom
Students need experience working with translations among tables, graphs, equations, and real-world situations. One difficult translation is the connection between a real-life situation and a graph. In the vignette below the teacher asks the students to use a motion detector hooked up to a graphing utility. One student is asked to walk back and forth in front of the motion detector so that the distance from the student to the motion detector follows a given graph. The independent variable in the situation is time the detector is on in seconds and the dependent variable is the distance between the student and the motion detector. The goal of the lesson is for students to be able to identify the function type, match the student movement with the features of the graph, and eventually find the equation of the original graph.
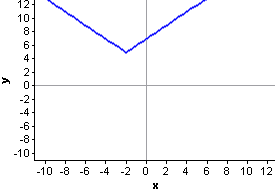
Walk the Graph Teacher: Try to use the motion detector to make a scatter plot that matches the graph shown below. Students work in groups of 4 with one motion detector.
Stacy: I am going to go first. [Pushes the trigger and begins to collect data.]
Yash: That is not very good. You needed to start about one and half meters from the detector thing not wait one and a half seconds. Alicia: Yeah, and you walked away at the same rate after one second. The graph looks like it goes fast then begins to slow down. Stacy: Fine, then you try it. Alicia: OK. [Moves to about 1.5 meters from the detector.] Push the trigger.
David: That is really good. Stacy: That is terrible. You started at the right place but you walked too slow at the beginning. You were at the right place at about one and a half seconds but then you were walking too fast. You needed to slow down a bit there. Yash: I think you were going at the right speed from three seconds on since the dots and the graph look to have the same rate of change there. Alicia: I think I need to start out faster but then keep moving away slower and slower. I should be about four and a half meters away at five seconds. The students take turns trying to match the graph a few more times and eventually matching the data closely. Teacher: Now that all the groups have matched the graph on the motion detector, please find an equation that matches the graph. David: Well at least it is not a straight line. Stacy: I think it is a square root function. Alicia: It can't be a square root function because it needs to pass through (0,0). Yash: What about $d=\sqrt{t}+1.5$ because it does look like a square root function but shifted up one and a half meters. Alicia started at one and a half meters away when we press the trigger. Alicia: [Graphs the function on the graphing utility.] It matches at (0,1.5) but does not really match much else. It really should go through (5,4.5). This function is at about three and a half at five seconds. David: So we know it should pass through (5,4.5). What if we solve this equation [writes $4.5=a\sqrt{5}+1.5$]. I get $a=1.34$. Our equation is d = 1.34t + 1.5. Yash: The graph matches pretty well. We are so cool. |
Resources
Teacher Notes
- Teachers need to help students sketch the graphs of common functions by helping them identify key points that they should calculate. To graph the function y = |x - 5| students should begin by knowing that the absolute value of a number is the distance that number is away from zero and is always non-negative. They should be able to reason that when x = 5 the value of the expression |x - 5| is minimized at zero. They should be able to connect this fact with the graph and realize that the point (5,0) is the minimum on the graph of the function. They should know that they only have to calculate two more ordered pairs to make an accurate sketch, one where x > 5 and one where x < 5.
Students should be able to use this same line of reasoning for most common functions. For example, if students are asked to sketch the graph of f(x) = -2(x + 3)2 + 5 they should be able to reason that the expression (x + 3)2 is non-negative and the minimum this expression can be is zero when x = -3. They should then be able to reason that the graph has an important point at (-3,5) called the vertex. As the values of x move away from -3, the value of the expression -2(x + 3)2 becomes more negative. This means that the parabola is pointing down. They should be able to make a pretty accurate sketch by calculating and plotting a point with an x-value greater than -3 and one that is less than -3.
Instruction on connecting the equation with the graph should focus on connecting parts of the expression that involves the independent variable and connecting what students know about the arithmetic of those expressions with the graph.
- Teachers need to spend time discussing the syntax of the graphing utility the students use in the classroom and at home. Teachers should try to pick examples that create an interesting discussion. For example, if someone want to evaluate the expression x2 for x = -3 they may enter -32 or (-3)2 into the calculator. Students should know which expression matches the desired output and which one does not. Students should then discuss if parenthesis are needed to graph the square function (i.e. y = x2 or y = (x)2 or does it not matter). Instruction should be specific on the syntax of the graphing utility and the reasons for the syntax.
Instructional Resources
- The turtle race activity provides students with an opportunity to make connections among representations of linear, quadratic, and square root functions.
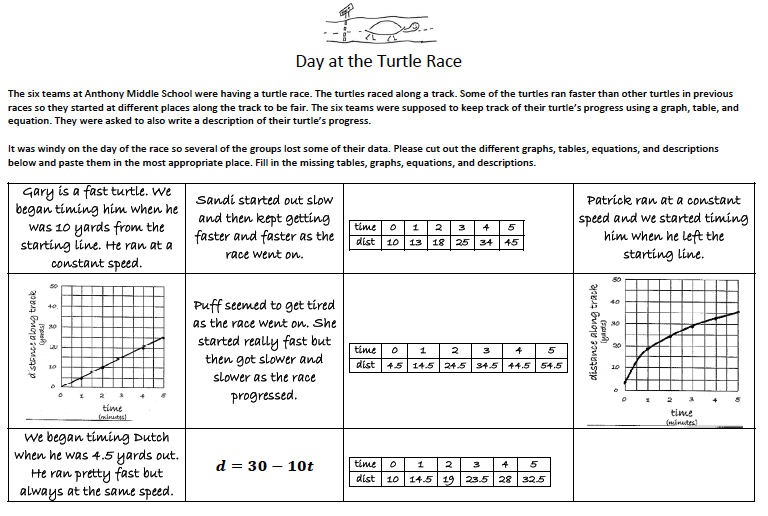
(See downloads at the end of the Resources section for a pdf of the activity)
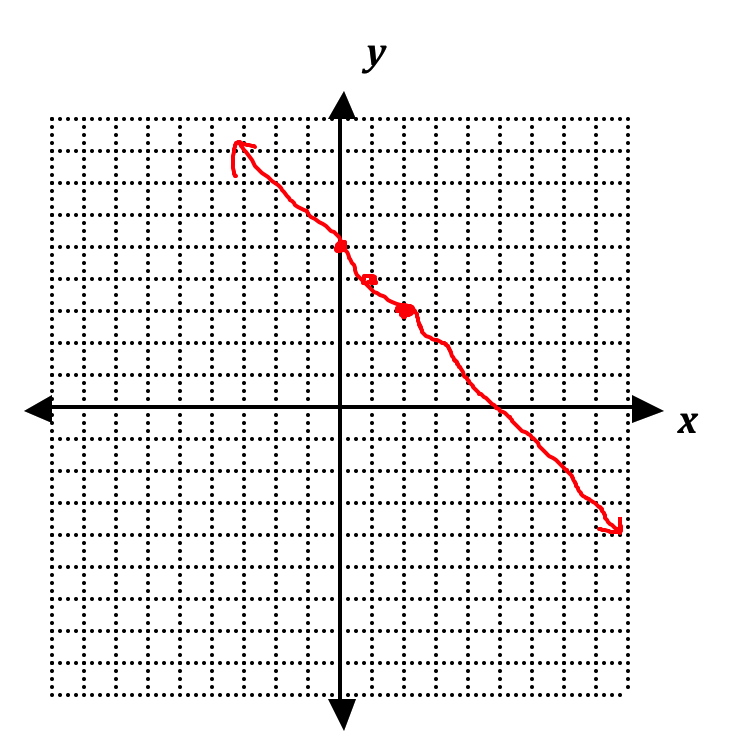
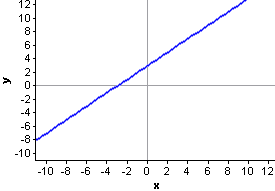
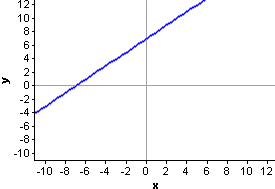
The students are asked to find a table and equation that matches the graph shown below.
Students need to be able to reason that this graph could be quadratic or a square root function. Students who choose to use a square root model should notice that the graph passes through the point (0,4.5) and not the origin and reason that the square root function $f(x)=\sqrt{x}$ needs to be translated vertically and use $g(x)=\sqrt{x}+4.5$ as their first guess. Eventually they should be able to change the parameters of the function to get something close to $d(t)=14\sqrt{t}+4.5$ for a function.
Use an interactive graphing tool to match equations of common functions with graphs
horizontal translation:
A shift in which a plane figure moves horizontally.
vertical translation:
A shift in which a plane figure moves vertically.
parameters: a set of independent variables that express the coordinates of a point.
Professional Learning Communities
Reflection - Critical Questions regarding the teaching and learning of these benchmarks
- What language do my students use to describe rate of change for linear and non-linear functions?
- Which function type do my students find most difficult to sketch accurately? Why?
- Are my students able to identify key points of each function type quickly?
- Do my students know how to use a graphing utility to graph functions and adjust the window to view key points?
- Are my students able to use graphing technology to compare the graphs of translated functions with the parent function?
Materials
- Zbiek, Rose Mary & Heid, M. Kathleen. "Digging Deeply into Intermediate Algebra: Using Symbols to Reason and Technology to Connect Symbols and Graphs." In Algebra and Algebraic Thinking in School Mathematics, 70th Yearbook of the National Council of Teachers of Mathematics, pp. 247-259. Reston, VA: 2008.
Common Core State Standards (http://www.corestandards.org/the-standards/mathematics)
Ruddell, M.R., & Shearer, B.A. (2002). "Extraordinary," "tremendous," "exhilarating, "magnificent": Middle school at-risk students become avid word learners with the vocabulary self-collection strategy (VSS). Journal of Adolescent & Adult Literacy, 45, 352-363.
Lobato - Leaky Faucet
Assessment
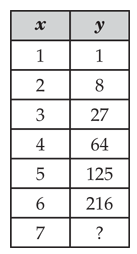
Example Item 1 The table below shows a cubic relationship between x and y.
If this pattern continues, what is the value of y when x = 7? Source: Maryland High School Assessment Algebra/Data Analysis - Item 7 (http://mdk12.org/assessments/high_school/look_like/2009/algebra/v7.html) Correct Answer: 343 Cognitive Level: |
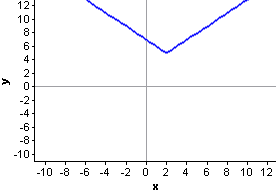
Example Item 2 Which graph below matches the function
Source: Made up Correct Answer: A Cognitive Level: Understanding |
Example Item 3 $f(x)=\sqrt{x+5}-2$ $g(x)=\sqrt{x+3}+3$ Describe how the graph of $f(x)$ is transformed to make the graph of $g(x)$. Source: Made up Correct Answer: The graph of $f(x)$ is translated horizontally to the right 2 units and vertically up 5 units. Cognitive Level: |
Differentiation
- Students who struggle with seeing how the graphs of f(x) = x3 and g(x) = (x - 7)3compare often are still seeing functions as a discrete set of points. They need to spend a lot of time selecting points that work for each function and become flexible with the points they select. Eventually they should be able to identify important points for each graph and show how these points correspond to each other through a horizontal shift of 7 units.
- One of the most important features that distinguish functions from each other is rate of change. Describing rates of change for functions can be difficult for students, especially EL's. The rate of change for the function $y=-2x+17$ can be described by saying that if the values of x are increasing, then the rate of change for the y values are decreasing at a constant rate. This vocabulary becomes even more confusing for functions like $y=\sqrt{x}-21$where the change in y is increasing at a decreasing rate as $x$ increases. The complexity of rate of change increases as students study more functions and the language needed to describe the change also increases in complexity. The activity described below allows the teacher to use complicated vocabulary to describe the rate of change for a function while the students sketch a graph on their paper. The teacher can informally assess student understanding of this vocabulary and re-teach as needed.
How Does it Change? | |
The students begin by sketching the x-and y-axis of the coordinate plane.
| |
Example 1: | |
Teacher says: "Start at (3,4)." | Students put their pencil tips on the graph at approximately (3,4). |
Teacher says: "As the value of x increases, the value of y increases at a constant rate." | Students sketch a graph with a rate of change that matches the description. Any graph that is a linear function that passes through (3,4) with positive slope works. Parts of an absolute value function could also work. |
Example 2: | |
"Draw a new coordinate axis. Start at (0,5)." | Pencil tips at (0,5) on a new graph. |
"As the value of x increases from 0, the value of y increases at an increasing rate." | There are many graphs that match the criteria. |
"What types of functions could work here?" | Correct responses could include exponential, quadratic, and cubic. It is true that not all exponential functions would satisfy these criteria. |
Example 3: | |
"Start at (-1,4) on a new axis." | Pencil tips at (-1,4) |
"As the value of x increases from -1, the value of y increases at a decreasing rate." | There are many graphs that match the criteria. |
The teacher continues to ask similar questions and continue to monitor student progress with this vocabulary and concept.
- Students should be challenged to apply their knowledge of common functions along with translations of these functions in non-standard situations. The Virus problem below describes a situation between two variables that does not fit any of the common function types as a whole. Students can begin to think of the graph of the function as being made up of several common function types and find a piecewise defined function to match the graph. This activity extends students' thinking of graphs of common functions to thinking of them as parts of a larger function.
Virus Seth lives in the town of Trolly, Alaska (pop. 100). He just came down with the flu. Nobody else in the town has the flu now. How long will it take for everyone in the town to get the flu given the following assumptions? Assumptions:
|
To answer this question students need to figure out what the independent and dependent variables are. The use of a simulation is one way to solve this problem. There are many ways to use random number generators to simulate the spread of the virus. One possible solution is found in the following table and graph.
|
|
Students should be able to figure out from this simulation that it took 13 days for the entire town of 100 people to get infected. Furthermore they should be able to explain why the number of infected people appears to be exponential for the first four days then why it becomes more linear between days four to eight. The student should also be able to explain why the days after day eight appear curved. They should be pushed to use translations to describe a piecewise defined function to show a rule of three parts that matches the trend.
A singular function that matches the data is called a logistic function. Some students should be able determine the value of the parameters $(a,b,c)$ of the function to match the data and explain why the values of the parameters match the situation. $e$ is Euler's constant and not one of the parameters.
$f(x)=\frac{c}{1-ae^{-bx}}$
Students who extend their knowledge of this standard should be able to apply what they learn in novel situations.
Parents/Admin
Administrative/Peer Classroom Observation
Students are: | Teachers are: |
describing features of various function types. | providing students with opportunities to describe the features they see with each function type. |
carrying out experiments that show relationships between pairs of variables. | providing students with opportunities to use manipulatives when appropriate, classroom demonstrations, video, and existing data to compare data. |
making connections among the representation of various function types. | asking questions to help students make connections among representations. Design activities that ask students to make connections to and from each pair of representations within each function type. |
Parent Resources
- Function Transformations
- Use an interactive graphing tool to match functions with transformations of these functions. Questions and activity sheets are provided.
- Grapher
- Use an interactive graphing tool change parameters of functions dynamically and observe the changes in the graphs.