9.2.2A Represent, Solve & Translate
Represent and solve problems in various contexts using linear and quadratic functions.
For example: Write a function that represents the area of a rectangular garden that can be surrounded with 32 feet of fencing, and use the function to determine the possible dimensions of such a garden if the area must be at least 50 square feet.
Represent and solve problems in various contexts using exponential functions, such as investment growth, depreciation and population growth.
Sketch graphs of linear, quadratic and exponential functions, and translate between graphs, tables and symbolic representations. Know how to use graphing technology to graph these functions.
Overview
Standard 9.2.2 Essential Understandings
Mathematical modeling is a process that allows students to describe and make sense of the relationship between an independent variable and a dependent variable found in a real-world setting. This standard specifies that high school students should be able to model situations using a variety of functions that include linear, quadratic, exponential, absolute value, inverse, power, square root, and other common functions. Students need to be able to fluidly translate among tables, graphs, and equations of these functions in order to match key features of these functions to real-world situations. The key features that separate these function types include intercepts, asymptotes, restricted domain, and rate of change. As students learn to make connections between the representations of the models and the real-world situation they begin to understand how variables in their life are connected to the mathematics they study in school as well as extend their knowledge of function types themselves.
All Standard Benchmarks
9.2.2.1
Represent and solve problems in various contexts using linear and quadratic functions.
For example: Write a function that represents the area of a rectangular garden that can be surrounded with 32 feet of fencing, and use the function to determine the possible dimensions of such a garden if the area must be at least 50 square feet.
9.2.2.2
Represent and solve problems in various contexts using exponential functions, such as investment growth, depreciation and population growth.
9.2.2.3
Sketch graphs of linear, quadratic and exponential functions, and translate between graphs, tables and symbolic representations. Know how to use graphing technology to graph these functions.
9.2.2.4
Express the terms in a geometric sequence recursively and by giving an explicit (closed form) formula, and express the partial sums of a geometric series recursively.
For example: A closed form formula for the terms tn in the geometric sequence 3, 6, 12,24, ... is tn = 3(2)n-1, where n = 1, 2, 3, ... , and this sequence can be expressed recursively by writing t1 = 3 and tn = 2tn-1,for n ≥ 2.
Another example: the partial sums sn of the series 3 + 6 + 12 + 24 + ... can be expressed recursively by writing s1 = 3 and sn = 3 + 2sn-1,for n ≥ 2.
9.2.2.5
Recognize and solve problems that can be modeled using finite geometric sequences and series, such as home mortgage and other compound interest examples. Know how to use spreadsheets and calculators to explore geometric sequences and series in various contexts.
9.2.2.6
Sketch the graphs of common non-linear functions such as $f\left ( x \right )=\sqrt{x}$, $f\left ( x \right )=\left |x\right |$, $f\left ( x \right )=\frac{1}{x}$, $f\left ( x \right )=x^{3}$, and translations of these functions, such as $f\left ( x \right )=\sqrt{x-2}+4$. Know how to use graphing technology to graph these functions.
Benchmark Group A
9.2.2.1
Represent and solve problems in various contexts using linear and quadratic functions.
For example: Write a function that represents the area of a rectangular garden that can be surrounded with 32 feet of fencing, and use the function to determine the possible dimensions of such a garden if the area must be at least 50 square feet.
9.2.2.2
Represent and solve problems in various contexts using exponential functions, such as investment growth, depreciation and population growth.
9.2.2.3
Sketch graphs of linear, quadratic and exponential functions, and translate between graphs, tables and symbolic representations. Know how to use graphing technology to graph these functions.
What students should know and be able to do [at a mastery level] related to these benchmarks
- Representing and solving problems using mathematical models can be sorted into two categories. Some problem situations match mathematical models exactly while in other problem situations the model can only approximate the data. Most experiments that involve measurement or the use of real-world data will have models that approximate the relationship. Students should be able to select and find an exact model when appropriate and an approximate model when appropriate.
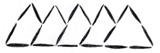
Exact Model - Toothpicks are used to make this picture of 5 overlapping triangles.
b) How many toothpicks would be used to make a picture with 13 overlapping triangles? c) How many toothpicks are needed to make a picture with n overlapping triangles? d) How many additional toothpicks are added each time you add a triangle? e) How many overlapping triangles can be made using 62 toothpicks?
|
Approximate Model -
a) How long is one shopping cart? |
- Students should be able to identify the variables involved in a situation and write equations to show how they are related. These situations can involve linear, quadratic, or exponential functions. In benchmark 9.2.2.1 the example provided asks student to solve the following problem:
"Write a function that represents the area of a rectangular garden that can be surrounded with 32 feet of fencing, and use the function to determine the possible dimensions of such a garden if the area must be at least 50 square feet."
Students need to identify the independent and dependent variables in this situation. The dependent variable is the area of the rectangle and is clearly mentioned in the problem. The independent variable is harder to identify in this situation since it could be the length, width, or even both dimensions of the rectangle. Students need to recognize that the independent variable could be either the length or the width and further that since the perimeter of the fence is fixed then once the length of the rectangle is specified then so is the width. Therefore if students select the length of the rectangle as the independent variable then the area of the rectangle is dependent on that choice. The students then need to be able to combine the formulas, $A_{rectangle}=l\times w$ and $P_{rectangle}=2l+2w$, to get the function $A(l)=l(16-l)$.
- Students should know that exponential functions have a multiplicative rate of change and the factors that cause exponential growth or decay. Given specific instances of the equation $f(x)=a\cdot b^{c-x}$, they should be able to distinguish between functions that describe exponential growth and ones that describe decay.
- Once students are able to plot a variety of functions point by point they need to move past seeing a function as a collection of points to one object representing a relationship between infinitely many points. Students should be able to quickly sketch the graph of a line from the equation by identifying intercepts and slope. They should be able to quickly recognize the various symbolic forms of a quadratic function and sketch the graph based on the format presented. Students should be able to identify and use the y-intercept and horizontal asymptote to sketch the graph of an exponential function given its equation.
- Students should be able to identify key features of a set of bivariate data presented in graphical form so they can determine the type of function that would best model the relationship between the two variables and then relate these features to the original context of the problem. Examples are shown below.
graph | what they should see |
| Students should be able to explain that there is a positive relationship between the variables (i.e. as the number of shopping carts increases the length of the train increases). They should be able to explain that the relationship between the variables looks linear and find a linear function that fits the data. They should further be able to explain how key features (i.e. slope and y-intercept) of the function relate to the original context. |
| The graph shows the actual age of dogs and what veterinarians use for approximate human age of dogs. Students should be able to explain that the relationship between actual age and human equivalent is positive and why it makes sense in the original context. The students should be able to rule out an exponential model based on the y-intercept of (0,0) and the absence of a horizontal asymptote. They should be able to reason that a square root function or a quadratic function could model the data and why. |
- Students should be familiar with the syntax required to graph various functions on a graphing utility and should be able to scale the window appropriately given the equation. For example, if a student was asked to graph the function y = (x + 5)(x - 23) they should be able to adjust the window to show the important features of the function including the vertex, y-intercept, and x-intercepts.
not so good | better | best |
|
|
|
graph of y = (x + 5)(x - 23) using the "standard" window | graph of y = (x + 5)(x - 23) showing the x-intercepts but not the vertex | graph of y = (x + 5)(x - 23) showing vertex, y-intercept, and x-intercepts |
- Students should be able to use a graphing utility to test and revise function models given a scatterplot of the data.
| The data in the graph show the population of the United States from 1800 to present. Students should be able to input the data into a graphing utility and reason that the relationship is exponential. The graph on the left shows an initial guess that should be adjusted further to fit the relationship better. Students should be able to enter the functions that they have studied and then make adjustments to find a model that captures the essence of the data well. |
- One of the most important features of using a graphing utility is the ability to link representations. A change in the equation results in corresponding changes in the table and graph. Students need to be familiar enough with the graphing utility they are using to easily make connections between the table, graph, and equation and be able to make adjustments in the display of any of the representations to highlight important features.
Work from previous grades that supports this new learning includes:
- In middle school students learn to use variables as pattern generalizers instead of simply representing unknowns. Knowing how to describe and use variables in these situations is crucial for students entering high school as they expand their knowledge of different non-linear functions.
- Students in middle school know how to find exact or approximate rates of change for linear functions given a table, graph, or equation. They can also determine that a function is non-linear given a table or graph.
- Students should know how to graph linear functions on a graphing utility and be able to access the table, graph, and equation features. They should be able to change the window settings to show important points, change the table settings to access trends in the values of the table, and be able to change the settings on the how the graphs are displayed (colors, dotted, dashed, etc.) on the graph.
NCTM Standards: (those that apply to 9.2.2 are bolded)
(p.296, PSSM) Instructional programs from Pre-K through grade 12 should enable all students to
Understand patterns, relations, and functions. In grades 9-12 all students should
- generalize patterns using explicitly defined and recursively defined functions;
- understand relations and functions and select, convert flexibly among, and use various representations for them;
- analyze functions of one variable by investigating rates of change, intercepts, zeros, asymptotes, and local and global behavior;
- understand and perform transformations such as arithmetically combining, composing, and inverting commonly used functions, using technology to perform such operations on more-complicated symbolic expressions;
- understand and compare the properties of classes of functions, including exponential, polynomial, rational, logarithmic, and periodic functions;
- interpret representations of functions of two variables.
Represent and analyze mathematical situations and structures using algebraic symbols. In grades 9-12 all students should
- understand the meaning of equivalent forms of expressions, equations, inequalities, and relations;
- write equivalent forms of equations, inequalities, and systems of equations and solve them with fluency - mentally or with paper and pencil in simple cases and using technology in all cases;
- use symbolic algebra to represent and explain mathematical relationships;
- use a variety of symbolic representations, including recursive and parametric equations, for functions and relations;
- judge the meaning, utility, and reasonableness of the results of symbol manipulations, including those carried out by technology.
Use mathematical models to represent and understand quantitative relationships. In grades 9-12 all students should
- identify essential quantitative relationships in a situation and determine the class or classes of functions that might model the relationships;
- use symbolic expressions, including iterative and recursive forms, to represent relationships arising from various contexts;
- draw reasonable conclusions about a situation being modeled.
Analyze change in various contexts. In grades 9-12 all students should
- approximate and interpret rates of change from graphical and numerical data.
Common Core State Standards (CCSM)
High School: Functions:
Interpret functions that arise in applications in terms of the context.
· F-IF.4. For a function that models a relationship between two quantities, interpret key features of graphs and tables in terms of the quantities, and sketch graphs showing key features given a verbal description of the relationship. Key features include: intercepts; intervals where the function is increasing, decreasing, positive, or negative; relative maximums and minimums; symmetries; end behavior; and periodicity.★
· F-IF.5. Relate the domain of a function to its graph and, where applicable, to the quantitative relationship it describes. For example, if the function h(n) gives the number of person-hours it takes to assemble n engines in a factory, then the positive integers would be an appropriate domain for the function.★
· F-IF.6. Calculate and interpret the average rate of change of a function (presented symbolically or as a table) over a specified interval. Estimate the rate of change from a graph.
Analyze functions using different representations.
· F-IF.7. Graph functions expressed symbolically and show key features of the graph, by hand in simple cases and using technology for more complicated cases.★
- Graph linear and quadratic functions and show intercepts, maxima, and minima.
- Graph square root, cube root, and piecewise-defined functions, including step functions and absolute value functions.
- Graph polynomial functions, identifying zeros when suitable factorizations are available, and showing end behavior.
- (+) Graph rational functions, identifying zeros and asymptotes when suitable factorizations are available, and showing end behavior.
- Graph exponential and logarithmic functions, showing intercepts and end behavior, and trigonometric functions, showing period, midline, and amplitude.
· F-IF.8. Write a function defined by an expression in different but equivalent forms to reveal and explain different properties of the function.
- Use the process of factoring and completing the square in a quadratic function to show zeros, extreme values, and symmetry of the graph, and interpret these in terms of a context.
- Use the properties of exponents to interpret expressions for exponential functions. For example, identify percent rate of change in functions such as $y=(1.02)^{t}$, $y=(0.97)^{t}$, $y=(1.01)^{12t}$, $y=(1.2)^{\frac{t}{10}}$, and classify them as representing exponential growth or decay.
· F-IF.9. Compare properties of two functions each represented in a different way (algebraically, graphically, numerically in tables, or by verbal descriptions). For example, given a graph of one quadratic function and an algebraic expression for another, say which has the larger maximum.
Misconceptions
Student Misconceptions and Common Errors
- Students sometimes only focus on the additive rate of change of the dependent variable to determine the rate of change of a function.
table | students say | students should say | ||||||||||
| "The slope is two since the values in the y-column are going up by two." | This response is correct but the rate of change of a function relies on coordinating the change in both variables. A statement that highlights this coordination would be: "The values of the y-variable are increasing by two for each change of one in the x-variable. | ||||||||||
| "The relationship is linear and it has a slope of three." | "The relationship is linear and the value of the y-variable increases by three for every increase of five of the x-variable. The rate of change is three-fifths." | ||||||||||
| "This relationship is not linear since the rate of change in the | "The relationship is linear with a rate of change of two." The correct rate of change could be determined symbolically using pairs of points. Some students may find the rate of change by making a graph. | ||||||||||
| "This relationship is linear because the y-variable goes up by 5 each time." | "The relationship is not linear. If you look at the graph of the function it looks like a curve. My guess is that the function is a translation of a square root function. I used my calculator to guess and check and came up with $f(x)=5\sqrt{x}+10$." |
- The idea of slope as a rate of change is difficult for students. In the shopping cart example a model for the length of the shopping cart train given the number of carts in the trains (c) could be L(c) = 33c + 74. Students could misinterpret the slope of 33 centimeters as the length of each cart rather than thinking of the 33 centimeters as the additional length added to the train length with the addition of one more shopping cart.
Vignette
In the Classroom
Students need to make sense of situations using tables, graphs, and equations. The example below shows a classroom scenario in which students are working with the Geometer's Sketchpad. A similar exploration can be done using Geogebra. The sketch shown below was created by the teacher and shows a rectangle that can be changed by moving point E around along segment AB. The rectangle was created so that the perimeter stays constant at 20 cm. The goal of the lesson is for students to study the relationship between the length of the rectangle (AE) and the area of the rectangle. The beginning of the lesson gets students to think about what the independent and dependent variables are and then moves to studying how they are related then eventually moves to how the table, graph, and equation help students make sense of the situation. Students come up with an argument for why the situation is quadratic and then move into questioning how the theoretical domain does not match the theoretical domain of the function.
Whole Class Discussion Students are working in pairs and each have a computer with the teacher created document open. Teacher: Please spend two minutes exploring the rectangle. Write at least three things you notice about the rectangle as you move point E along segment AB.
After 2 minutes Teacher: What did you notice, Elmer? Elmer: I noticed that the rectangle gets skinny and fat. Teacher: What do you mean by skinny? Elmer: When point E gets close to point B then the rectangle is skinny. It gets more fat when E is in the middle. Ella: The rectangle gets more fat when E is next to B, and more skinny when E is next to A. Teacher: Ella, what does fat and skinny mean? Ella: Fat is wide, and skinny is thin but tall. Elmer: I used skinny to mean not much area and fat to mean more area. Teacher: Let's use the terms more area and less area instead of fat and skinny. Does anyone notice anything else? Mia: I noticed that the rectangle disappears when E is on top of B. Teacher: What do you mean it disappears? Mia: It does not have any area. Teacher: So as you move point E around does the area of the rectangle change? Elmer: No, it stays the same. Mia: It is changing. Teacher: Measure the area and the perimeter of the rectangle and see how they change as you move point E around.
Han: The perimeter stays the same but the area is changing. Elmer: I noticed that EB is the same length at DE so that is why the perimeter is staying the same. Ella: It is always going to stay at 20cm because AE and DE add up to 10 and that is half the rectangle. Teacher: We agree that the area is changing and that the perimeter stays the same. Furthermore, we know that the length of segment AE is between 0 cm and 10 cm. Spend some time working with your partner and determine how the area is changing as the length of AE changes. After 5 minutes Ella: The area gets bigger when AE is about 5 cm. The area gets to almost 0 when AE is 10 cm.
Han: The area is also 0 when AE is close to 0 cm. Elmer: How can the area of the rectangle be 25 cm2? If you multiply 5.4 and 4.6 you get 24.95. Teacher: The computer is rounding to the nearest tenth. Talk to your partner and try to determine the area of the rectangle if the length of AE is 6 cm. Mia: That is easy, it is 24 cm2. All you have to do is multiply 6 by 4. Teacher: On your own, sketch a graph of how the area of the rectangle changes with the length of AE.
three different possible student sketches
Teacher: Your computer will let you look at the graph of the relationship between the length of AE and the area. What does the graph look like?
Elmer: It looks like an upside down parabola. This makes sense since 25 cm2 is the largest the area could be. Also the area is 0 when AE is 10 cm or 0 cm. I am not sure why there is a curve on the graph. Teacher: With your partner, find the equation for this parabola and explain why it matches this situation. After 10 minutes Mia: I found the equation to be $A=l(10-l)$ because area is length times width and the width is always $10$ minus the length. This proves that it is a parabola because $l(10-l)=10l-l^{2}$ and $A=10l-l^{2}$ is the equation of a parabola. Han: I knew the vertex of the parabola was at (5,25) and it was pointing down so I guessed $A=-1(x-5)^{2}+25$ and it worked. When I enter the equation in the computer the graph matches but goes further down on both ends. My equation must be wrong since it says I can have negative area when the length is bigger than 10 cm.
Teacher: Han, what does the $x$ represent in your equation? Han: I'm not sure, oh it represents the length of AE. Teacher: The length of AE has to be larger than 0 cm and less than 10 cm. Your equation is correct but it only works in this context for values of $x$ between 0 and 10 cm. The domain of your function is limited to these values. Mia's equation also has this restriction on the domain. |
Resources
Teacher Notes
- Students are provided many examples that include tables that are well-ordered and struggle making sense of tables that are not well-ordered. For example, in the Leaky Faucet problem below, students will often state that the faucet is not leaking at a constant rate since the amount of water presented in the table is not increasing at a constant rate.
Leaky Faucet Cassandra decided to see how fast her bathtub faucet was leaking. She got a large container and put it under her faucet when she got up in the morning, and then checked periodically during the day to see how much water was in the container. She wrote the times and the amounts down. They are in the table below. Did the faucet leak at a constant rate?
Source: Lobato |
To solve the Leaky Faucet problem students first need to identify the independent variable. The time that the measurement occurs helps inform this relationship but a better independent variable to test is Elapsed Time in minutes. Some student may select 7:00 a.m. as time t = 0 minutes. Others may choose 6:45 a.m. as time t = 0 since that is the time when there is 0 ounces of water in the container. The relationship between elapsed time and amount of water in the container will be linear regardless of when t = 0 is selected because the faucet drips two ounces of water every 15 minutes. Instruction should focus on helping students see how the change in the elapsed time is related to the change in the number of ounces of water regardless of how the intervals of measurement are chosen.
- Square Graphs
Interactive graph that shows relationships among characteristics of a square
- Barbie Bungee
This lesson involves students doing an experiment to study the relationship between weight and length of stretch of a bungee apparatus made of rubber bands.
- Egg Launch Contest
Students will represent quadratic functions as a table, with a graph, and with an equation. They will compare data and move between representations.
Additional Instructional Resources
- GeoGebra
Geogebra is an interactive mathematics tool that can be used to investigate algebraic functions and geometry. The web site includes the program and sample lessons.
rate of change:
The change in the value of a quantity divided by the elapsed time. Commonly used examples include miles per gallon (miles/gallon), feet per second (feet/second),gallons per minute (gallons/minute), etc.
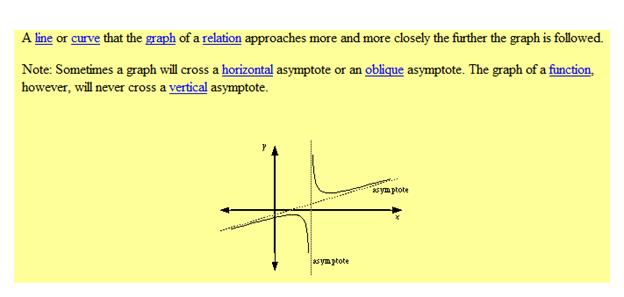
asymptote:
independent variable: 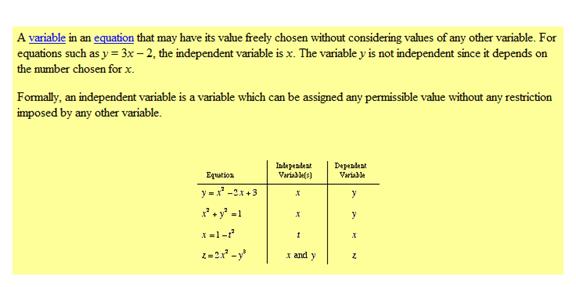
dependent variable: 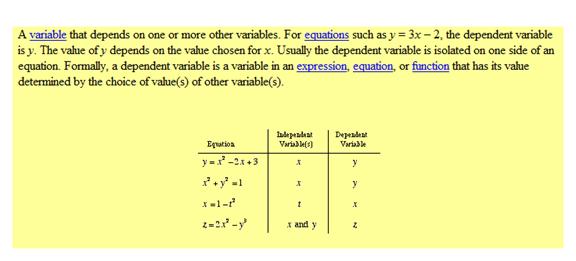
mathematical model:
An equation or a system of equations representing real-world phenomena. Models also represent patterns found in graphs and/or data. Usually models are not exact matches the objects or behavior they represent. A good model should capture the essential character of whatever is being modeled.
Reflection - Critical Questions regarding the teaching and learning of these benchmarks
- Does my instruction of functions focus too much on one representation?
- How do real-world examples help my students understand the differences and similarities between linear and exponential functions?
- Do my students relate their final answer to the original context consistently?
- How do my students organize data using table that are not well ordered?
- Which representations do my students prefer most?
Materials - suggested articles and books
- Usiskin, Zalman. "Conceptions of school algebra and uses of variables." In The Ideas of Algebra, K-12, 1988 Yearbook of the National Council of Teachers of Mathematics, pp. 8-19. Reston, VA: 1988.
- Gay, A. Susan & Jones, Alyson. "uncovering variables in the context of modeling activities." In Algebra and Algebraic Thinking in School Mathematics, 70th Yearbook of the National Council of Teachers of Mathematics, pp. 211-221. Reston, VA: 2008.
- Anderson, Nancy. "Walk the line: Making sense of
 ." In Algebra and Algebraic Thinking in School Mathematics, 70th Yearbook of the National Council of Teachers of Mathematics, pp. 233-246. Reston, VA: 2008.
Common Core State Standards (http://www.corestandards.org/the-standards/mathematics)
Ruddell, M.R., & Shearer, B.A. (2002). "Extraordinary," "tremendous," "exhilarating, "magnificent": Middle school at-risk students become avid word learners with the vocabulary self-collection strategy (VSS). Journal of Adolescent & Adult Literacy, 45, 352-363.
Lobato - Leaky Faucet
Assessment
Example Item 1
Source: MCAII Item Sampler 11th Grade Mathematics (http://education.state.mn.us/MDE/Accountability_Programs/Assessment_and_Testing/Assessments/MCA/Samplers/index.html) Correct Answer: D Cognitive Level: Understanding |
Example Item 2
The graph above shows distance versus time for a race between runners A and B. The race is already in progress, and the graph shows only the portion of the race that occurred after 11 A.M. The table on the next page lists several characteristics of the graph. Interpret these characteristics in terms of what happened during this portion of the race. Include times and distances to support your interpretation. (A sample interpretation of the y-intercepts is given in the table.)
Source: NAEP Grade 12, 2009, Question M2-9 (http://nces.ed.gov/nationsreportcard/itmrlsx/detail.aspx?subject=mathematics) Correct Answer:
Cognitive Level: Hard (28.28% correct) |
Example Item 3 10. The following chart indicates the maximum number of connecting line segments y that can be drawn connecting x points, where no three points lie on the same line.
(a) The relationship between x and y is represented by the equation y = kx(x - 1) for any positive number of points x. Use the information in the table to determine the value of the real number k. Answer: k = ____________________ (b) Use the equation from part (a) to determine the maximum number of line segments that can be drawn connecting 100 points, no three of which lie on the same line. Answer: ____________________ Source: NAEP Grade 12, 2009, Question M7-10 (http://nces.ed.gov/nationsreportcard/itmrlsx/detail.aspx?subject=mathematics) Correct Answer: (a) Answer: $k=\frac{1}{2}$ (b) Answer: 4,950 Cognitive Level: Hard (28.69% correct) |
Example Item 4
5. Which of the following graphs best illustrates the relationship between exercise time and total calories burned, as shown in the table above?
Source: NAEP Grade 12, 2005, Question M3-5 (http://nces.ed.gov/nationsreportcard/itmrlsx/detail.aspx?subject=mathematics) Correct Answer: C Cognitive Level: Easy (28.69% correct)
|
Example Item 5
|
Differentiation
It takes time for students to learn the key features of linear, quadratic, and exponential functions. Extra time may be needed for students to identify these key features in tables, graphs, equations, and real-world situations. Teachers should observe the representations that a struggling student prefers and help them make connections with the other ones. Identifying individual data points for each representation is a good start before looking at the entire function that can describe the relationship between infinitely many pairs of points.
English Learners (EL) need to taught strategies for identifying key content vocabulary. One strategy is the Vocabulary Self-Collection Strategy (VSS) (Ruddell & Shearer, 2002). Students first read a problem then work individually or in groups to identify key content vocabulary. For example, students might read the Shopping Cart Problem individually then before they attempt to solve the problem they work in pairs to identify key vocabulary that they need to know in order to make sense of and solve the problem.
Shopping Cart Problem Shopping carts in the parking lots of stores are put together to form trains. Susan English and Tim Erickson measured 12 different trains. They counted the number of carts in each train and measured the length of that train of carts in centimeters.
a) How long is one shopping cart? b) How much does one shopping cart fit into the next one? c) One set of carts was 486 cm long. How many carts? d) Find an equation that models the length of a shopping cart train in centimeters given the number of shopping carts in the train. |
The words in the problem highlighted in red above are possible words that may be selected by a classroom of students. A classroom discussion then takes place about the meanings of these words in the context of this problem. Ruddell and Shearer (2002) found that if students are taught to use the VSS and given opportunities to practice they will begin to self-select words they need to know independently and their reading comprehension will improve.
As students develop in their modeling abilities they begin to notice that function rules have limitations for many situations. For example, in the shopping cart example the students might come up with the rule L(c) = 33c + 74 for the length of a cart train with c carts. Students should realize that the domain should be limited to whole numbers greater than 0. Some students may argue that since 0 carts is 0 centimeters long then the relationship is not linear. It is true that the equation L(c) = 33c + 74 does not contain the point (0,0) as shown in the graph on the right below students should be taught that rules can be written for situations in which there may be multiple formulas for different values of the domain.
|
|
Students who study beyond the standard should learn how to develop rules to match situations and define the rules piecewise.
\begin{align}L(c)=\begin{cases}
0 &c=0 \\
33c+74 & c>0
\end{cases}\end{align}
Furthermore they should understand that this notation defines only one rule that has multiple parts.
Parents/Admin
Administrative/Peer Classroom Observation
Students are: (make list) | Teachers are: (make list) |
making connections among representations of functions. | asking students to highlight features of functions in each representation. |
sorting functions based on key features. | selecting good examples of functions for students to sort. |
identifying the independent variable and dependent variable in situations. | teachers are asking students to identify what the independent and dependent variables are in a situation. |
Parent Resources
Solving a problem involving linear functions
Representing and solving a problem involving two variables