1.1.1C Number & Data
Use counting and comparison skills to create and analyze bar graphs and tally charts.
For example: Make a bar graph of students' birthday months and count to compare the number in each month.
Overview
Standard 1.1.1 Essential Understandings
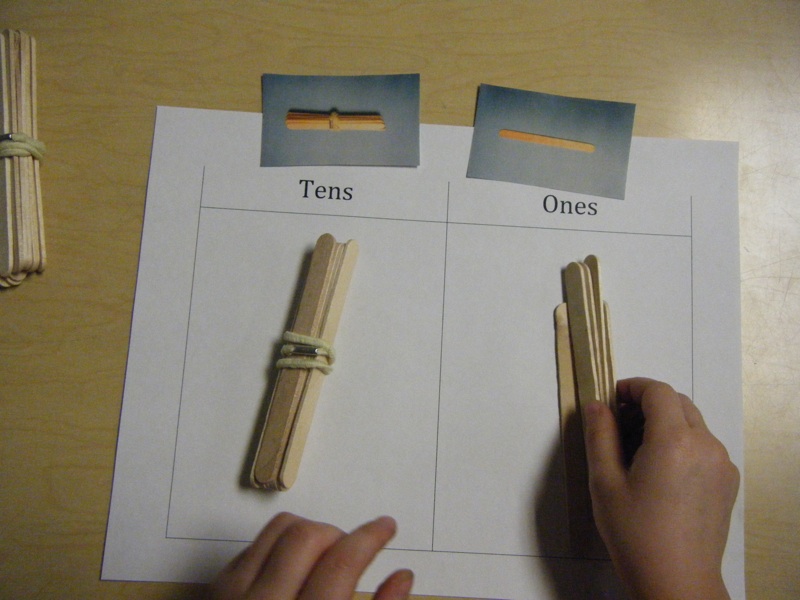
First graders read, write and represent whole numbers up to 120. Representations for numbers include numerals, pictures, tally marks, number lines, addition and subtraction and manipulatives (including base ten blocks). Formal work with place value begins as students describe two-digit numbers in terms of tens and ones; i.e. 37 can be represented as 37 ones or as 3 tens and 7 ones or as 2 tens and 17 ones. First graders use place value knowledge to compare and order numbers up to 120 and to find a number that is 10 more or 10 less than a given two-digit number. They describe the relative magnitude of numbers using words such as equal to, more than, less than, fewer than, or about the same as.
All Standard Benchmarks
1.1.1.1 Use place value to describe whole numbers between 10 and 100 in terms of groups of tens and ones. For example: Recognize the numbers 11 to 19 as one group of ten and a particular number of one
1.1.1.2 Read, write and represent whole numbers up to 120. Representations may include numerals, addition and subtraction, pictures, tally marks, number lines and manipulatives, such as bundles of sticks and base 10 blocks
1.1.1.3 Count, with and without objects, forward and backward from any given number up to 120.
1.1.1.4 Find a number that is 10 more or 10 less than a given number. For example: Using a hundred grid, find the number that is 10 more than 27.
1.1.1.5 Compare and order whole numbers up to 100.
1.1.1.6 Use words to describe the relative size of numbers. For example: Use the words equal to, not equal to, more than, less than, fewer than, is about, and is nearly to describe numbers.
1.1.1.7 Use counting and comparison skills to create and analyze bar graphs and tally charts.
For example: Make a bar graph of students' birthday months and count to compare the number in each month.
Benchmark Group C
1.1.1.7 Use counting and comparison skills to create and analyze bar graphs and tally charts.
What students should know and be able to do [at a mastery level] related to these benchmarks:
- answer questions and gather data about themselves and their surroundings;
- represent data using concrete objects, pictures, tally charts and graphs;
- describe and compare categories in a data display;
- understand that titles and labels are needed on data representations so the information can be interpreted correctly;
- use the information on a graph to answer questions.
Work from previous grades that supports this new learning includes:
- sort and classify objects according to attributes;
- use words such as more, less, and about the same when comparing numbers.
NCTM Standards
Understand numbers, ways of representing numbers, relationships among numbers, and number systems.
Pre-K - 2 Expectations:
- count with understanding and recognize "how many" in sets of objects;
- use multiple models to develop initial understandings of place value and the base-ten number system;
- develop understanding of the relative position and magnitude of whole numbers and of ordinal and cardinal numbers and their connections;
- develop a sense of whole numbers and represent and use them in flexible ways, including relating, composing, and decomposing numbers;
- connect number words and numerals to the quantities they represent, using various physical models and representations.
Common Core State Standards
Extend the counting sequence.
1.NBT.1. Count to 120, starting at any number less than 120. In this range, read and write numerals and represent a number of objects with a written numeral.
Understand place value.
1.NBT.2. Understand that the two digits of a two-digit number represent amounts of tens and ones. Understand the following as special cases:
1.NBT.2a. 10 can be thought of as a bundle of ten ones - called a "ten."
1.NBT.2b. The numbers from 11 to 19 are composed of a ten and one, two, three, four, five, six, seven, eight, or nine ones.
1.NBT.2c. The numbers 10, 20, 30, 40, 50, 60, 70, 80, 90 refer to one, two, three, four, five, six, seven, eight, or nine tens (and 0 ones).
1.NBT.3. Compare two two-digit numbers based on meanings of the tens and ones digits, recording the results of comparisons with the symbols >, =, and <.
Represent and interpret data.
1.MD.4. Organize, represent, and interpret data with up to three categories; ask and answer questions about the total number of data points, how many in each category, and how many more or less are in one category than in another.
Misconceptions
Student Misconceptions and Common Errors
Students may think ...
- data can go in any category on a graph or chart.
- the category with the greatest quantity is the "winner."
- comparing data in two data categories means combining the data.
- the picture in a pictograph always represents one.
- the titles and labels in a data display are not important.
- "How many more?" and "How many in all?" mean the same thing.
Vignette
In the Classroom
Students in this vignette have had a variety of experiences with data collection, data displays and data analysis. During this lesson, they will be displaying information in more than one data representation.
Ms. G.: Who can tell me what "data" means?
Serena: It's like information you get from people.
Ms. G.: Tell me more . . .
Serena: Well, you can ask them questions and keep track of their answers.
Ms. G.: What kind of data have we collected this year?
Evan: We asked people how they got to school - car, walk, or bus.
Cian: I remember that! We did that one a long time ago.
Bardilio: We did our favorite foods.
Armando: We did number of pockets on Pocket day!
Ms. G.: What are some of the ways we have organized the data we collected?
Serena: We made some tally charts.
Grace: Bar graphs.
Ms. G.: Let's list some ideas about data we can collect today.
Rotho: We could do our favorite class.
Ms. G.: Wouldn't everyone choose math as their favorite?
Giggles all around. . . .
Kim: Let's graph the colors in a big bag of Skittles!
Ms. G.: That would be fun, but I don't have any Skittles!
Cam: Let's do our names.
Ms. G.: Tell me more . . .
Cam: Count the letters.
Ms. G.: Do you want to do our first names or last names?
Cam: First names.
Ms. G.: Okay. We'll collect data about the number of letters in our first names. Let's start by making a cube tower that has one cube for each letter in your first name.
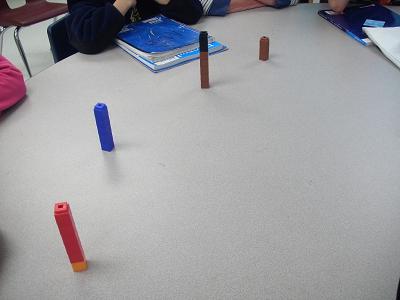
The children got to work building their cube towers.
Ms. G.: I see everyone has a tower. Evan, why do you have four cubes in your tower?
Evan: There are four cubes because I have four letters in my first name.
Ms. G.: Hannah, Evan has four cubes in his tower but you do not. Why?
Hannah: My name has six letters H-A-N-N-A-H. My tower has to have six cubes.
Ms. G.: How can we organize the information we have about our first names?
Grace: Let's show our towers. We can put them in order.
Ms. G.: How should we start?
Evan: Who has the smallest first name?
Cam: I do - I have three letters.
Kim: So do I!
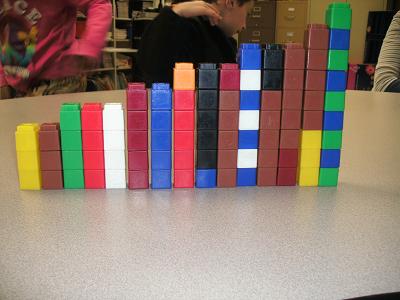
Ms. G.: Let's stack the towers on the table.
The kids put the towers on the table, working with each other to get them in ascending order.
Ms. G.: What do you notice about our towers?
Evan: Two people have only three letters in their names!
Ms. G.: What do you notice about the tallest tower?
Cian: It's kinda hard to figure out how tall it is. I know Christian has the longest name, but it's hard to tell how many letters.
Ms. G.: What would be a way to display our data that would make it easier to read?
Serena: We could make a tally chart.
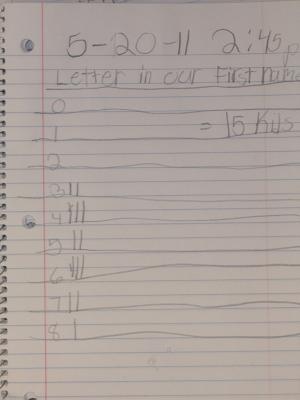
Ms. G.: What would be a clear title for our tally chart?
Cam: How about "Letters in Our First Names?"
Ms. G.: That's pretty clear. Please get out your notebooks. Set up a tally chart. We've got the title. What should we write here on the left?
Armando: Can we start with 0 and go up?
Ms. G.: Does it make sense to have 0 letters in your name?
Armando: No, you can't have 0 letters in a name. But it should start at zero any way.
Ms. G.: Sounds good! Let's start at zero and work our way up. How far up should we go?
Armando: How about up to ten?
Ms. G.: Why to ten. Armando?
Armando: Because ten letters is more than anyone's first name.
Ms. G.: Sure, let's do that.
Ms. G. draws a tally chart on the board while the children draw in their notebooks.
Ms. G.: Let's fill in the tally chart.
How many people have 0 letters in their names?
Whole Class: No one!
Ms. G.: How many people have 1 letter in their names?
Whole Class: No one!
Ms. G.: How about 2 letters?
Evan: I know a kid named T.J.
Ms. G.: Let's just work with the names of people in our class.
Serena: We already know that three letters is the smallest name and two kids have three letters.
Ms. G.: Okay, so what do I do on the tally chart?
Serena: Put two tallies by the 3.
Ms. G.: I'll put two tallies up here; you all do it in your notebooks.
What's next?
Anthony: Four letters.
Ms. G.: How many kids have four letters in their first names?
Anthony: Three.
Ms. G.: Okay - you fill in your charts and I'll fill in the one on the board.
Diana: I have five letters in my name and so does Grace.
Ms. G.: What should I do?
Diana: Put two tallies by the five.
Ms. G. and the class work through all the names in the class to build the tally chart.
 .
.
Ms. G.: Cam, how many letters in the longest name in our class?
Cam: That's easy! It's nine letters for Christian.
Ms. G.: What else does our tally chart tell us?
Armando: There are 15 kids in our class today.
Ms. G.: How can you tell that from the tally chart?
Armando: I counted the tallies.
Ms. G.: How do you know that means there are that many kids here today?
Armando: 'Cause every tally means someone's name!
Ms. G.: Good point!
Kim: Six has the most tallies.
Ms. G.: So, what does that mean?
Kim: Most kids have six letters.
Ms. G.: Are you saying most of the kids in our class have six letters in their names?
Kim: No, that's not right. I know six has the most, but I can't figure out how to say it.
Ms. G.: We could say that more kids in our class have six letters in their first names than any other number of letters. That's a mouthful, isn't it?
Resources
Teacher Notes
● Students may need support in further development of previously studied concepts and skills.
● "Constructing and interpreting graphs, especially bar graphs, is important in grades preK- 2 because it provides children an opportunity to count and compare sets of objects-two big ideas in number and operations," explains Francis "Skip" Fennell, president of the National Council of Teaching Mathematics (NCTM).
● Students need to see bar graphs in both vertical and horizontal forms.
● Students will focus on the physical characteristic of the data representation and need the language to describe what this means when answering the original question. Note: A question such as, "Which column has the most/least?" does not connect the data representation to the meaning of the collected data.
● Encourage first graders to make observations and make predictions when collecting data.
● Data analysis should be integrated with other content areas rather than being taught solely in math class.
● The data analysis process includes the following:
○ Formulate a question (teacher guided).
○ With teacher direction, children formulate questions in conjunction with lessons on counting, measurement, numbers, and patterns.
○ Make a plan for data collection.
○ Collect data.
○ Organize data and select a data representation.
○ Data representations (pie charts and circle graphs are not appropriate for second grade).
○ Charts (charts include a title, categories, category labels, and data).
○ Tally marks (tally charts include a title, categories, category labels, and data)
○ Bar graphs (bar graphs should be drawn both vertically and horizontally, and include a title, scale, scale label, categories, category labels and data).
○ Analyze Data (when posing questions about collected and represented data refer to the initial question).
○ Use language that keeps the focus on the meaning of the data categories. For example:
- What do you know when looking at the graph, chart or table? Guide student responses so that they are related to the original question not the height of the bars on the graph. Students will look for patterns and draw conclusions based on the data.
- Which category shows the greatest, least number or any given number of responses to the original question? What does this tell us? Students will focus on the physical characteristic of the data representation and need the language to describe what this means when answering the original question. Note: A question such as, "Which column has the most?" does not connect the data representation to the meaning of the collected data.
- Asking questions that require students to compare two or more categories (with reference to the original question) involves a higher level of thinking.
○ Reflect on the original question. Does the data we collected answer the original question? What else do you wonder about?
- Good questions, and good listening, will help children make sense of the mathematics, build self-confidence and encourage mathematical thinking and communication. A good question opens up a problem and supports different ways of thinking about it. The best questions are those that cannot be answered with a "yes" or a "no."
Getting Started
What do you need to find out?
What do you know now? How can you get the information? Where can you begin?
What terms do you understand/not understand?
What similar problems have you solved that would help?
While Working
How can you organize the information?
Can you make a drawing (model) to explain your thinking? What are other possibilities?
What would happen if...?
Can you describe an approach (strategy) you can use to solve this?
What do you need to do next?
Do you see any patterns or relationships that will help you solve this?
How does this relate to...?
Why did you...?
What assumptions are you making?
Reflecting about the Solution
How do you know your solution (conclusion) is reasonable? How did you arrive at your answer?
How can you convince me your answer makes sense?
What did you try that did not work? Has the question been answered?
Can the explanation be made clearer?
Responding (helps clarify and extend their thinking)
Tell me more.
Can you explain it in a different way?
Is there another possibility or strategy that would work?
Is there a more efficient strategy?
Help me understand this part ...
(Adapted from They're Counting on Us, California Mathematics Council, 1995)
Instructional Resources
NCTM Illuminations
- Tallies, Ten Frames, and Baseball Games Your home team can set the stage for students to make math connections. Students will record wins and losses in different formats to discover connections between many of the concepts taught earlier in the year. This lesson will provide daily and weekly practice with patterns, addition and subtraction equations, number models and math communication.
- Eye to Eye: Students learn to pose mathematical questions about themselves and their surroundings through class. They gather data about eye color from their classmates and another class within their school. They organize this data to answer questions.
Additional Instructional Resources
Baratta-Lorton, M. (1994). Mathematics their way. Menlo Park, CA: Addison-Wesley Publishing Co.
Bereska, C., Bolster, C., Bolster, L., & Scheaffer, R. (1998). Exploring statistics in the elementary grades: book 1, grades K-6. Parsippany, NJ: Dale Seymour Publications.
Sheffield, L., Cavanagh, M., Dacey, L., Findell, C., Greenes, C., & Small, M. (2001). Navigating through data analysis and probability in prekindergarten-grade 2. Reston, VA: National Council of Teachers of Mathematics.
Small, M. (2009). Good questions: great ways to differentiate mathematics instruction. New York, NY: Teachers College Press.
Van de Walle, J., Karp, K., Bay-Williams, J. (2010). Elementary and middle school mathematics: teaching developmentally. (7th Ed.) Boston, MA: Allyn & Bacon.
Van de Walle, J. & Lovin, L. (2006). Teaching student-centered mathematics grades k-3. Boston, MA: Pearson Education.
bar graph: a graph that organizes data into vertical or horizontal bars that do not touch and displays how many times each event in the data occurs (this graph is used to graph categorical data).
tally marks: are recorded in groups of 5. ![]()
"Vocabulary literally is the
key tool for thinking."
Ruby Payne
Mathematics vocabulary words describe mathematical relationships and concepts and cannot be understood by simply practicing definitions. Students need to have experiences communicating ideas using these words to explain, support, and justify their thinking.
Learning vocabulary in the mathematics classroom is contingent upon the following:
Integration: Connecting new vocabulary to prior knowledge and previously learned vocabulary. The brain seeks connections and ways to make meaning which occurs when accessing prior knowledge.
Repetition: Using the word or concept many times during the learning process and connecting the word or concept with its meaning. The role of the teacher is to provide experiences that will guarantee connections are made between mathematical concepts, relationships, and corresponding vocabulary words.
Meaningful Multiple and varied opportunities to use the words in context. These
Use: opportunities occur when students explain their thinking, ask clarifying questions, write about mathematics, and think aloud when solving problems. Teachers should be constantly probing student thinking in order to determine if students are connecting mathematics concepts and relationships with appropriate mathematics vocabulary.
Strategies for vocabulary development
Students do not learn vocabulary words by memorizing and practicing definitions. The following strategies keep vocabulary visible and accessible during instruction.
Mathematics Word Bank: Each unit of study should have word banks visible during instruction. Words and corresponding definitions are added to the word bank as the need arises. Students refer to word banks when communicating mathematical ideas which leads to greater understanding and application of words in context.
Labeled pictures and charts: Diagrams that are labeled provide opportunities for students to anchor their thinking as they develop conceptual understanding and increase opportunities for student learning.
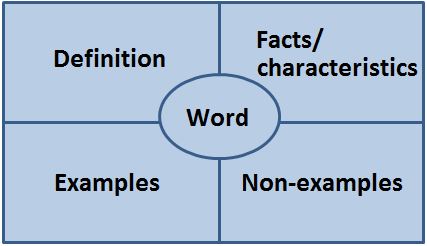
Frayer Model: The Frayer Model connects words, definitions, examples and non-examples.
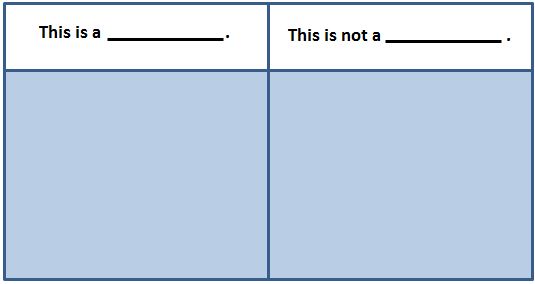
Example/Non-example Charts: This graphic organizer allows students to reason about mathematical relationships as they develop conceptual understanding of mathematics vocabulary words. Teachers should use these during the instructional process to engage student in thinking about the meaning of words.
Vocabulary Strips: Vocabulary strips give students a way to organize critical information about mathematics vocabulary words.
|
word |
definition |
illustration |
Encouraging students to verbalize thinking by drawing, talking, and writing increases opportunities to use the mathematics vocabulary words in context.
Additional Resources for Vocabulary Development
Murray, M. (2004). Teaching mathematics vocabulary in context. Portsmouth, NH: Heinemann.
Sammons, L. (2011). Building mathematical comprehension: Using literacy strategies to make meaning. Huntington Beach, CA: Shell Education.
Reflection - Critical questions regarding the teaching and learning of these benchmarks
- What are the key ideas related to place value at the first grade level? How do student misconceptions interfere with mastery of these ideas?
- What models should a student be able to make when representing 84, using tens and ones?
- When checking for student understanding of place value at the first grade level, what should teachers...
listen for in student conversations?
look for in student work?
ask during classroom discussions?
- How can teachers assess student learning related to these benchmarks?
- Examine student work related to a task involving place value at the first grade level. What evidence do you need to say a student is proficient? Using three pieces of student work, determine what student understanding is observed through the work.
- How are these benchmarks related to other benchmarks at the first grade level?
Professional Learning Community Resources
Bamberger, H., Oberdorf, C., & Schultz-Ferrell, K. (2010). Math misconceptions prek-grade 5: From misunderstanding to deep understanding. Portsmouth, NH: Heinemann.
Chapin, S. and Johnson, A. (2006). Math matters: Understanding the math you teach, grades K-8. (2nd Ed.). Sausalito, CA: Math Solutions Press.
Chapin, S., O'Connor, C., & Canavan Anderson, N. (2009). Classroom discussions: Using math talk to help students learn (Grades K-6). Sausalito, CA: Math Solutions.
Dougherty, B., Flores, A., Louis, E., & Sophian, C. (2010). Developing essential understanding of number & numeration pre-k-grade 2. Reston, VA: National Council of Teachers of Mathematics
Fosnot, C., & Dolk, M. (2001). Young mathematicians at work: Constructing number sense, addition, and subtraction. Portsmouth, NH: Heinemann.
Fuson, K., Clements, D., & Beckmann, S. (2009). Focus in grade 1: Teaching with curriculum focal points. Reston, VA: National Council of Teachers of Mathematics.
Hyde, Arthur. (2006). Comprehending math: Adapting reading strategies to teach mathematics,
K-6. Portsmouth, NH: Heinemann.
Lester, F. (2010). Teaching and learning mathematics: Transforming research for elementary school teachers. Reston, VA: National Council of Teachers of Mathematics.
Sammons, L. (2011). Building mathematical comprehension: Using literacy strategies to make meaning. Huntington Beach, CA: Shell Education.
Wright, R., Stanger, G., Stafford, A., & Martland, J. (2006). Teaching number in the classroom with 4-8 year-olds. London: Paul Chapman Publishing.
Bamberger, H., Oberdorf, C., & Schultz-Ferrell, K. (2010). Math misconceptions prek-grade 5: From misunderstanding to deep understanding. Portsmouth, NH: Heinemann.
Baratta-Lorton, M. (1994). Mathematics their way. Menlo Park, CA: Addison-Wesley Publishing Co.
Bender, W. (2009). Differentiating math instruction: Strategies that work for k-8 classrooms! Thousand Oaks, CA: Corwin Press.
Bresser, R., Melanese, K., & Sphar, C. (2008). Supporting English language learners in math class, Grades k-2. Sausalito, CA: Math Solutions Publications.
Burns, M. (Ed.). (1998). Leading the way: Principals and superintendents look at math instruction. Sausalito, CA: Math Solutions.
Cavanagh, M. (2006). Math to learn: A mathematics handbook. Wilmington, MA: Great Source Education Group, Inc.
Chapin, S. and Johnson, A. (2006). Math matters: Understanding the math you teach, Grades K-8 (2nd ed.). Sausalito, CA: Math Solutions Press.
Chapin, S., O'Connor, C., & Canavan Anderson, N. (2009). Classroom discussions: Using math talk to help students learn (Grades K-6). Sausalito, CA: Math Solutions.
Conklin, M. (2010). It makes sense! Using ten-frames to build number sense, grades k-2, Sausalito, CA: Math Solutions Press.
Dacey, L., & Salemi, R. (2007). Math for all: Differentiating instruction k-2. Sausalito, CA: Math Solutions.
Donovan, S., & Bradford, J. (Eds). (2005). How students learn: Mathematics in the classroom. Washington, DC: National Academies Press.
Felux, C., & Snowdy, P. (Eds.). (2006). The math coach field guide: Charting your course. Sausalito, CA: Math Solutions.
Fosnot, C., & Dolk, M. (2001) Young mathematicians at work: Constructing number sense, addition, and subtraction. Portsmouth, NH: Heinemann.
Hyde, Arthur. (2006) Comprehending math: Adapting reading strategies to teach mathematics,
K-6. Portsmouth, NH: Heinemann.
Kilpatrick, J., & Swafford, J. (Eds). (2001). Adding it up: Helping children learn mathematics. Washington, DC: National Academies Press.
Leinwand, S. (2000). Sensible mathematics: A guide for school leaders. Portsmouth, NH: Heinemann.
Lester, F. (2010). Teaching and learning mathematics: Transforming research for elementary school teachers. Reston, VA: National Council of Teachers of Mathematics.
Murray, M. (2004). Teaching mathematics vocabulary in context. Portsmouth, NH: Heinemann.
Murray, M. & Jorgensen, J. (2007). The differentiated math classroom: A guide for teachers k-8. Portsmouth, NH: Heinemann.
Parrish, S. (2010). Number talks: Helping children build mental math and computation strategies grades K-5. Sausalito. CA: Math Solutions.
Sammons, L., (2011). Building mathematical comprehension: Using literacy strategies to make meaning. Huntington Beach, CA: Shell Education.
Seeley, C. (2009). Faster isn't smarter: Messages about math teaching and learning in the 21st century. Sausalito, CA: Math Solutions.
Small, M. (2009). Good questions: Great ways to differentiate mathematics instruction. New York, NY: Teachers College Press.
Van de Walle, J., Karp, K., Bay-Williams, J. (2010). Elementary and middle school mathematics: Teaching developmentally. (7th ed.). Boston, MA: Allyn & Bacon.
Van de Walle, J. & Lovin, L. (2006). Teaching student-centered mathematics grades k-3. Boston, MA: Pearson Education.
West, L., & Staub, F. (2003). Content focused coaching: Transforming mathematics lessons. Portsmouth, NH: Heinemann.
Wright, R., Martland, J., Stafford, A., & Stanger, G. (2006). Teaching number (2nd Ed.). London: Sage Publishing.
Wright, R., Stanger, G., Stafford, A., & Martland, J. (2006). Teaching number in the classroom with 4-8 year-olds. London: Paul Chapman Publishing.
Assessment
- Miss Streff's class collected data about their favorite cookie.
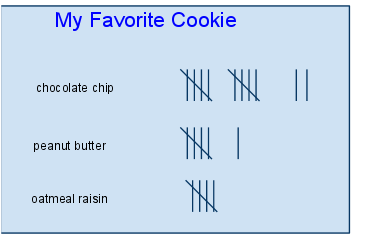
1. Which cookie did most of the students choose as their favorite?
2. How many students chose oatmeal raisin as their favorite cookie?
3. What was the least favorite cookie?
4. How many more students chose peanut butter than oatmeal raisin as their favorite cookie?
5. How many fewer students chose oatmeal raisin than chocolate chip as their favorite cookie?
Solution:
1. chocolate chip
2. five
3. oatmeal raisin
4. one
5. seven
Benchmark: 1.1.1.7
Finish the chart using the following information.
Monday - ten books read
Tuesday - two books read
Wednesday - thirteen books read
Thursday - eight books read
Friday - six books read
Number of Books Read This Week
Monday
Tuesday / /
Wednesday
Thursday / / / /
Friday
Solution: Correct tally chart display of information.
Benchmark: 1.1.1.7
- Mr. Blom had a group of students who loved to play sports. They were asked, "What is your favorite sport?"
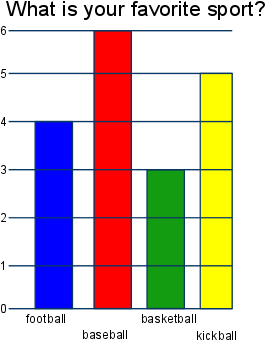
Which was the least favorite sport?
How many students liked basketball and football all together?
How many fewer students liked kickball than baseball?
Solution: basketball, 7, 1
Benchmark: 1.1.1.7
- Using a small bag of M & M's, create a tally chart to show the colors of M & M's. Make sure to include a title and labels on your tally chart. Use the tally chart to determine the total number of M & M's in the bag. Explain your thinking.
Sample student created tally chart.
M & M Colors
|
Red |
|
|
Yellow |
|
|
Green |
|
|
Orange |
|
|
Brown |
|
|
Blue |
|
Solution: Student created tally chart displays correct number of each color of M & M's in the bag. Tally chart includes appropriate title and labels. Students give the correct number of M & M's in the bag.
Benchmark:1.1.1.7
Differentiation
These students may need additional experience sorting and classifying objects. A chart or graph can be used to represent the sorting and will help students connect the data display to the act of sorting and the grouping of objects.
Learners who are emergent in their thinking may benefit from more experiences graphing at the concrete level by using actual items to construct a graph and then transferring the information to a tally chart or a bar graph.
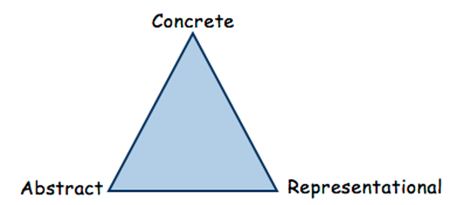
Concrete - Representational - Abstract Instructional Approach
The Concrete-Representational-Abstract Instructional Approach (CRA) is a research-based instructional strategy that has proven effective in enhancing the mathematics performance of students who struggle with mathematics.The CRA approach is based on three stages during the learning process:
Concrete - Representational - Abstract
The Concrete Stage is the doing stage. The concrete stage is the most critical in terms of developing conceptual understanding of mathematical skills and concepts. At this stage, teachers use manipulatives to model mathematical concepts. The physical act of touching and moving manipulatives enables students to experience the mathematical concept at a concrete level. Research shows that students who use concrete materials develop more precise and comprehensive mental representations, understand and apply mathematical concepts, and are more motivated and on-task. Manipulatives must be selected based upon connections to the mathematical concept and the students' developmental level.
The Representational Stage is the drawing stage. Mathematical concepts are represented using pictures or drawings of the manipulatives previously used at the Concrete Stage. Students move to this level after they have successfully used concrete materials to demonstrate conceptual understanding and solve problems. They are moving from a concrete level of understanding toward an abstract level of understanding when drawing or using pictures to represent their thinking. Students continue exploring the mathematical concept at this level while teachers are asking questions to elicit student thinking and understanding.
The Abstract Stage is the symbolic stage. Teachers model mathematical concepts using numbers and mathematical symbols. Operation symbols are used to represent addition, subtraction, multiplication and division. Some students may not make a clean transfer to this level. They will work with some symbols and some pictures as they build abstract understanding. Moving to the abstract level too quickly causes many student errors. Practice at the abstract level will not lead to increased understanding unless students have a foundation based upon concrete and pictorial representations.
Additional Resources
Bender, W. (2009). Differentiating math instruction: Strategies that work for k-8 classrooms! Thousand Oaks, CA: Corwin Press.
Dacey, L., & Lynch, J. (2007). Math for all: Differentiating instruction grades k-2. Sausalito, CA: Math Solutions.
Murray, M. & Jorgensen, J. (2007). The differentiated math classroom: A guide for teachers, k-8. Portsmouth, NH: Heinemann.
Small, M. (2009). Good questions: Great ways to differentiate mathematics instruction. New York, NY: Teachers College Press.
Van de Walle, J., Karp, K., Bay-Williams, J. (2010). Elementary and middle school mathematics: Teaching developmentally. (7th Ed.). Boston, MA: Allyn & Bacon.
Van de Walle, J. & Lovin, L. (2006). Teaching student-centered mathematics grades k-3. Boston, MA: Pearson Education.
- Using a data display to represent the sorting of real objects will help English Language Learners develop the meaning of a chart or graph and provide an opportunity for students to connect appropriate vocabulary to their work.
- Word banks need to be part of the student learning environment in every mathematics unit of study.
- Use vocabulary graphic organizers such as the Frayer model (see below) to emphasize vocabulary words count, first, second, third, etc.
- Sentence Frames
Math sentence frames provide support that English Language Learners need in order to fully participate in math discussions. Sentence frames provide appropriate sentence structure models, increase the likelihood of responses using content vocabulary, help students to conceptualize words and build confidence in English Language Learners.
Sample sentence frames related to these benchmarks:
|
This graph shows __________________________________________. |
|
I know ____________________ because _______________________. |
- When assessing the math skills of an ELL student it is important to determine if the student has difficulty with the math concept or with the language used to describe the concept and conceptual understanding.
Additional ELL Resources:
Bresser, R., Melanese, K., & Sphar, C. (2008). Supporting English language learners in math class, grades k-2. Sausalito, CA: Math Solutions Publications.
- Students can develop questions classmates might answer for a given data display.
- After formulating their own question, students collect, display and analyze data.
Additional Resources
Bender, W. (2009). Differentiating math instruction-strategies that work for k-8 classrooms! Thousand Oaks, CA: Corwin Press.
Dacey, L., & Lynch, J. (2007). Math for all: Differentiating instruction grades k-2. Sausalito, CA: Math Solutions.
Murray, M. & Jorgensen, J. (2007). The differentiated math classroom-A guide for teachers k-8. Portsmouth, NH: Heinemann.
Small, M. (2009). Good questions: Great ways to differentiate mathematics instruction. New York, NY: Teachers College Press.
Parents/Admin
Administrative/Peer Classroom Observation
|
Students are ... |
Teachers are ... |
|
using actual objects to collect and represent data on a chart in order to make counts and comparisons more easily. For example, crayons, books, or shoes. |
creating real world experiences for data collection that have meaning for students such as favorite snack, number of family members, etc. |
|
analyzing data in bar graphs and tally charts to answer questions. |
asking questions to engage students in a discussion about the meaning of data in a graph or tally chart. "What do you know about our class when you look at the hair color graph"? |
|
comparing information on a bar graph or tally chart. |
asking open-ended questions like: How do you know? Will that always be the case? What are the similarities and differences between . . .? What questions could you ask that could be answered with this data?
|
What should I look for in the mathematics classroom? (Adapted from SciMathMN,1997)
What are students doing?
- Working in groups to make conjectures and solve problems.
- Solving real-world problems, not just practicing a collection of isolated skills.
- Representing mathematical ideas using concrete materials, pictures and symbols. Students know how and when to use tools such as blocks, scales, calculators, and computers.
- Communicating mathematical ideas to one another through examples, demonstrations, models, drawing, and logical arguments.
- Recognizing and connecting mathematical ideas.
- Justifying their thinking and explaining different ways to solve a problem.
What are teachers doing?
- Making student thinking the cornerstone of the learning process. This involves helping students organize, record, represent, and communicate their thinking.
- Challenging students to think deeply about problems and encouraging a variety of approaches to a solution.
- Connecting new mathematical concepts to previously learned ideas.
- Providing a safe classroom environment where ideas are freely shared, discussed and analyzed.
- Selecting appropriate activities and materials to support the learning of every student.
- Working with other teachers to make connections between disciplines to show how math is related to other subjects.
- Using assessments to uncover student thinking in order to guide instruction and assess understanding.
Additional Resources
For Mathematics Coaches
Chapin, S. and Johnson, A. (2006). Math matters: Understanding the math you teach: Grades k-8, 2nd edition. Sausalito, CA: Math Solutions.
Donovan, S., & Bradford, J. (Eds). (2005). How students learn: Mathematics in the classroom. Washington, DC: National Academies Press.
Felux, C., & Snowdy, P. (Eds.). (2006). The math coach field guide: Charting your course. Sausalito, CA: Math Solutions.
Sammons, L., (2011). Building mathematical comprehension: Using literacy strategies to make meaning. Huntington Beach, CA: Shell Education.
West, L., & Staub, F. (2003). Content focused coaching: Transforming mathematics lessons. Portsmouth, NH: Heinemann.
For Administrators
Burns, M. (Ed). (1998). Leading the way: Principals and superintendents look at math instruction. Sausalito, CA: Math Solutions.
Kilpatrick, J., & Swafford, J. (Eds). (2001). Adding it up: Helping children learn mathematics. Washington, DC: National Academies Press.
Leinwand, S. (2000). Sensible mathematics: A guide for school leaders. Portsmouth, NH: Heinemann.
Lester, F. (2010). Teaching and learning mathematics: Transforming research for school administrators. Reston, VA: National Council of Teachers of Mathematics.
Seeley, C. (2009). Faster isn't smarter: Messages about math teaching and learning in the 21st century. Sausalito, CA: Math Solutions.
Mathematics handbooks to be used as home references:
Cavanagh, M. (2004). Math to Know: A mathematics handbook. Wilmington, MA: Great Source Education Group, Inc.
Cavanagh, M. (2006). Math to learn: A mathematics handbook. Wilmington, MA: Great Source Education Group, Inc.
Helping your child learn mathematics
Provides activities for children in preschool through grade 5
http://www2.ed.gov/parents/academic/help/math/part.html#p1
What should I look for in the mathematics program in my child's school? A Guide for Parents developed by SciMathMN
http://www.scimathmn.org/sub/parents_mathclass.htm
Help Your Children Make Sense of Math
Ask the right questions
In helping children learn, one goal is to assist children in becoming critical and independent thinkers. You can help by asking questions that guide, without telling them what to do.
Good questions, and good listening, will help children make sense of the mathematics, build self-confidence and encourage mathematical thinking and communication. A good question opens up a problem and supports different ways of thinking about it. The best questions are those that cannot be answered with a "yes" or a "no."
Getting Started
What do you need to find out?
What do you know now? How can you get the information? Where can you begin?
What terms do you understand/not understand?
What similar problems have you solved that would help?
While Working
How can you organize the information?
Can you make a drawing (model) to explain your thinking? What are other possibilities?
What would happen if . . . ?
Can you describe an approach (strategy) you can use to solve this?
What do you need to do next?
Do you see any patterns or relationships that will help you solve this?
How does this relate to...?
Can you make a prediction?
Why did you...?
What assumptions are you making?
Reflecting about the Solution
How do you know your solution (conclusion) is reasonable? How did you arrive at your answer?
How can you convince me your answer makes sense?
What did you try that did not work?
Has the question been answered?
Can the explanation be made clearer?
Responding (helps clarify and extend their thinking)
Tell me more.
Can you explain it in a different way?
Is there another possibility or strategy that would work?
Is there a more efficient strategy?
Help me understand this part...
Adapted from They're counting on us, California Mathematics Council, 1995
Books to Read Aloud:
The best vacation ever, by Stuart J. Murphy
Lemonade for sale, by Stuart J. Murphy