7.2.2A Represent Proportional Relationships
Represent proportional relationships with tables, verbal descriptions, symbols, equations and graphs; translate from one representation to another. Determine the unit rate (constant of proportionality or slope) given any of these representations.
For example: Larry drives 114 miles and uses 5 gallons of gasoline. Sue drives 300 miles and uses 11.5 gallons of gasoline. Use equations and graphs to compare fuel efficiency and to determine the costs of various trips.
Overview
7.2.2 Essential Understandings
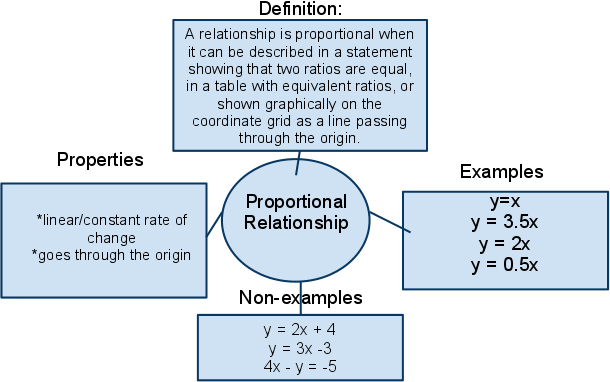
Students have had prior experience with situations involving a change in one quantity effecting a corresponding change in another. This previous experience has included graphical, tabular, and function rule representations of these relationships. This standard extends the prior understanding to proportional situations. Proportional relationships are a specific linear relationship. When these proportional relationships are graphed, the representation is a line passing through the origin. In other representations of a proportional relationship (tabular, verbal, symbols, or equations), the idea may not be initially evident, but in each representation a constant rate of change can be determined. From translation between these representations, students explore this constant rate of change to determine a unit rate (constant of proportionality or slope). The more connections students can make between these multiple forms of representation, the deeper their understanding of the relationship. With this understanding, students will be able to move to other linear relationships that are not proportional (with a graph that is a line that does not pass through the origin).
All Standard Benchmarks
7.2.2.1
Represent proportional relationships with tables, verbal descriptions, symbols, equations and graphs; translate from one representation to another. Determine the unit rate (constant of proportionality or slope) given any of these representations.
7.2.2.2
Solve multi-step problems involving proportional relationships in numerous contexts.
7.2.2.3
Use knowledge of proportions to assess the reasonableness of solutions.
7.2.2.4
Represent real-world or mathematical situations using equations and inequalities involving variables and positive and negative rational numbers.
Benchmark Group A - Proportional Relationships
Benchmark 7.2.2.1 Represent proportional relationships with tables, verbal descriptions, symbols, equations and graphs; translate from one representation to another. Determine the unit rate (constant of proportionality or slope) given any of these representations.
For example: Larry drives 114 miles and uses 5 gallons of gasoline. Sue drives 300 miles and uses 11.5 gallons of gasoline. Use equations and graphs to compare fuel efficiency and to determine the costs of various trips.
What students should know and be able to do [at a mastery level] related to these benchmarks
- Identify the unit rate using the representation.
- Make a table of a given relationship.
- Write an equation/function of a proportional relationship.
- Make a graph of a proportional relationship.
- Translate from one representation of a proportional relationship to another.
Work from previous grades that supports this new learning includes:
- graphing in the first quadrant
- reading tables
- changing a written rule into an equation; e.g., the cost, C, of lunch is $4.50 for every meal, m. C = 4.50m
- solving ratio and rate situations in multiple strategies
- finding unit rate by dividing or scaling down
- scaling ratios up or down using multiplication
- finding equivalent fractions
- understanding that a variable can be used to represent a quantity that can change often in relationship to another changing quantity
- using variables in various contexts
- using function rules
- translating between function rules, tables and graphs
- making tables
- determining dependent and independent variables
NCTM Standards
Relate and compare different forms of representation for a relationship:
- identify functions as linear or nonlinear and contrast their properties from tables, graphs, or equations.
Common Core State Standards (CCSS)
Ratios and Proportional Relationships
7.RP: Analyze proportional relationships and use them to solve real-world and mathematical problems.
7.RP.1 Compute unit rates associated with ratios of fractions, including ratios of lengths, areas and other quantities measured in like or different units. For example, if a person walks $\frac{1}{2}$ mile in each $\frac{1}{4}$ hour, compute the unit rate as the complex fraction $\frac{\frac{1}{2}}{\frac{1}{4}}$ miles per hour, equivalently 2 miles per hour.
7.RP.2. Recognize and represent proportional relationships between quantities.
- 7.RP.2b. Identify the constant of proportionality (unit rate) in tables, graphs, equations, diagrams, and verbal descriptions of proportional relationships.
- 7.RP.2c. Represent proportional relationships by equations. For example, if total cost t is proportional to the number n of items purchased at a constant price p, the relationship between the total cost and the number of items can be expressed as t = np.
7.RP.3 Use proportional relationships to solve multi-step ratio and percent problems. Examples: simple interest, tax, markups and markdowns, gratuities and commissions, fees, percent increase and decrease, percent error.
Misconceptions
- Slope is not just found on a graph. A constant rate of change in tabular form is also slope.
- Determining the wrong unit rate by dividing in the wrong order.
- When comparing unit rates, students think the higher rate is the better deal.
- Students reverse the variables placing them on the incorrect graph axes, and confuse the independent and dependent variables in the equation.
Vignette
In the Classroom
The teacher gives each student a secret ballot to vote for his or her favorite type of music. Collect the ballots and display the ratio for each group.
T: Ok, we have 6 out of class that enjoy alternative music. What is the ratio of the students that enjoy alternative music?
S: We don't know how many are in the class.
T: Well, let's count. Okay, we have 30 in the class. Now what is the ratio?
S: 6:30?
T: Yes, that is right. Do we know another way to write a ratio, one that we are more comfortable with?
S: As a fraction, like $\frac{6}{30}$?
T: Yes. So, if we have 270 in the middle school, how many could we predict that enjoy alternative music?
S: Hmmmm...
T: What do we know already?
S: That 6 out of the 30 like alternative?
T: Correct. And if we know that, how will that help us figure out how many like alternative?
S: Find the percent?
T: Yes, we could. Any other way?
S: Find the unit rate.
T: "Yes, we could. So if we have $\frac{6}{30}$, then how many would be out of 270? What would that look like?"
(Have a student come to the board and write down initial thoughts.)
A student comes to the board and writes: $\frac{6}{30}=\frac{x}{270}$
$.2=\frac{x}{270}$
T: So, how could we solve this?
S: 0.2 is the unit rate so multiply that by 270 students. So there are 54 students in the school that like alternative music.
T: Nice job. We also have learned how to use cross multiplication to solve this. But I'm glad you used what you know about unit rates to solve this problem. Nice!
Resources
Just because a student can use the cross-product algorithm to solve a proportion does not mean they understand proportional relationships. Simply going through the steps does not mean they understand what they get for an answer and do not know if it is proportional.
- A common method to solve word problems involving proportional relationships is "set up proportions and cross-multiply." This method is useful for a narrow range of problems (where the two variables have exactly two values each), and is not a good foundation for understanding proportional relationships more generally (where two variables can each have infinite values) as they appear in algebra and beyond. It is important to highlight the proportional relationships between variables in the problems.
- When teaching how to find unit rate, have students divide in the order of the label. For example, if they are trying to find miles per gallon, they would divide miles by gallons, in the same order as the label.
- When discussing cost of items, students need to be mindful of the label and see that they want a lower cost per item, but higher items per dollar, which are the same terms but in a different order meaning completely different things.
- Be sure that students are viewing proportional relationships in a variety of representations. They need to recognize characteristics of each representation that makes a proportional relationship; e.g., a graph's y-intercept is (0,0). Also ask students to calculate the unit rate for the proportional situation from each of the different representations; e.g., on a graph the unit rate is the slope.
- Students should be able to relate variable expressions and equations to other forms of representations, such as tables, graphs, and verbal descriptions. One way of developing competency in this area is to use a functional approach. Give students a table of values and have them generate a rule (functions) to describe the relationship. For example, consider the following table:
|
From this table, students should notice that the y value is always equal to three times the x value. Stating this relationship using variables, y = 3x, they can see that the y value divided by the x value is always 3, and is thus proportional. Adapted from Translating Words into Symbols:
- Progressing from pure representation of a proportional relationship to setting up and solving problems proportionally, given either a table, graph, or a written description of a problem situation, students should be able to create the other two forms. "As students move into middle school, the ideas of function and variable become more important. Representation of functions as patterns, via tables, verbal descriptions, symbolic descriptions, and graphs can combine to promote a flexible grasp of the idea of function. Linear functions receive special attention. They connect to the ideas of proportionality and rate, forming a bridge that will eventually link arithmetic to calculus. Symbolic manipulation in the relatively simple context of linear equations is reinforced by other means of finding solutions, including graphing by hand or with calculators." (NAEP 2009 Mathematics Framework, p. 31)
- Bagel Algebra A real-life example-taken from a bagel shop, of all places-is used to get students to think about solving a problem symbolically. Students must decipher a series of equations and interpret results to understand the point that the bagel shop's owner is trying to make.
- Measuring Up Students learn to write and solve proportions by gathering data and calculating unit rates.
Additional Instructional Resources
- Review proportions
- A Texas Instruments Nspire activity for Middle Grades Math: Proportionality in Tables, Graphs, and Equations.
- Algebra Zapping Zombies. In this lesson students translate among representations so that their understanding can advance from words to tables to graphs to equations. The concepts are covered in the context of playing a video game where Zombies are zapped to score points and advance a level in the game. Introduce to students the background about the video game. The main goal of the game is to earn points by zapping Zombies. Have a brief conversation about game levels and points earned. As students work through this lesson keep them focused on the relationship between the different parts of the table.
- Top Ten Ideas about Proportional Relationships (that Students should take into High School Mathematics).
proportional: In mathematics, two variable quantities are proportional if one of them is always the product of the other by a constant quantity, called the constant of proportionality. In other words, x and y are proportional if the ratio $\frac{y}{x}$ is constant. We also say that one of the quantities is proportional to the other. For example, if the speed of an object is constant, it travels a distance proportional to the travel time.
origin: the point (0,0) on a coordinate axes system, where the x and y axis cross.
slope: the ratio of rise to run as found on a graph of a line; represents the rate of change of a linear situation.
Reflection - Critical Questions regarding the teaching and learning of these benchmarks
- Are students clear on what a proportional relationship is?
- Can students identify relationships that are proportional and those that are not?
- Given just a verbal description, can students determine if the relationship is proportional?
- What is proportionality?
- How can change be best represented mathematically?
- How can we use mathematical language to describe change?
- How can we use mathematical models to describe change or change over time?
- How can patterns, relations, and functions be used as tools to best describe and help explain real-life situations?
Materials
NCTM's book Developing Essential Understanding of Ratios, Proportions, and Proportional Reasoning for Teaching Mathematics: Grades 6-8
Top Ten Ideas about Proportional Relationships (that Students should take into High School Mathematics)
Bounds, H. M., Chapman, C., Green, T., Kaase, K., Sewell, B.H., & Thompson, M. (2007). Mississippi mathematics framework revised strategies. Jackson, MS: Mississippi Dept. of Education.
Cramer, K., & Post, T. (1993, May). Connecting research to teaching proportional reasoning. Mathematics Teacher, 86(5), 404-407.
Helping students gain understanding and self-confidence in algebra. www.purplemath.com
Insights into Algebra 1: Linear functions and inequalities. http://www.learner.org/workshops/algebra/workshop2/index2.html
National Council of Teachers of Mathematics. (n.d.). Developing essential understanding of ratios, proportions, and proportional reasoning for teaching mathematics: Grades 6-8. Reston, VA: NCTM.
Top ten ideas about proportional relationships (that students should take into high school mathematics). http://web.me.com/serpmedia/ToolPresentation/Tool___Articulation_2_files/Top%20ten%20list-1.pdf
Assessment
- The graph below shows the relationship between the number of tickets sold for a band concert and the amount of money, in dollars, collected from the sales of the first 30 tickets.
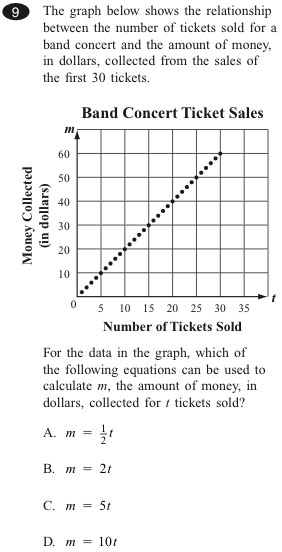
Answer: Choice B
Massachusetts Comprehensive Assessment System Release of Spring 2009 Test Items
- One serving of Lara's favorite yogurt contains 150 calories. Which of the following graphs shows the relationship between the number of calories and the number of servings of Lara's favorite yogurt?
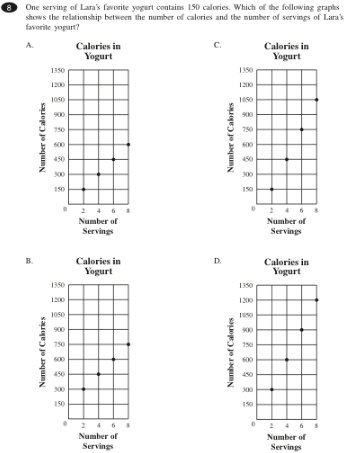
Answer: Choice D
Massachusetts Comprehensive Assessment System Release of Spring 2010 Test Items
- Anita and Jerry are reading the same book. The graphs below show the number of pages Anita and Jerry read each day for five days
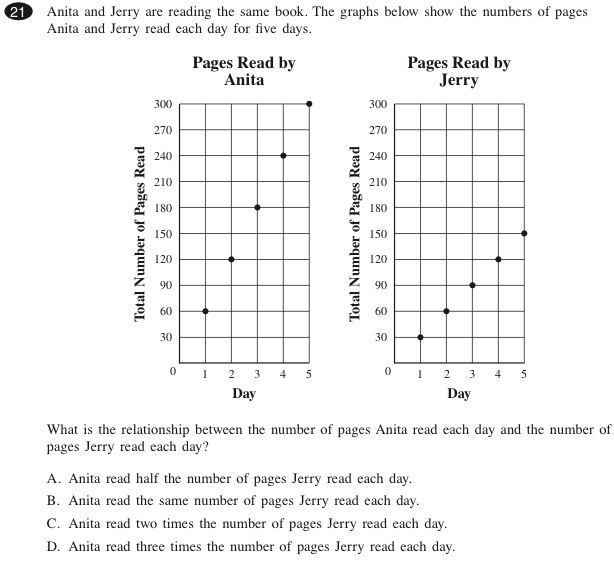
Answer: Choice C
Massachusetts Comprehensive Assessment System Release of Spring 2010 Test Items
- Which represent a proportional relationship?
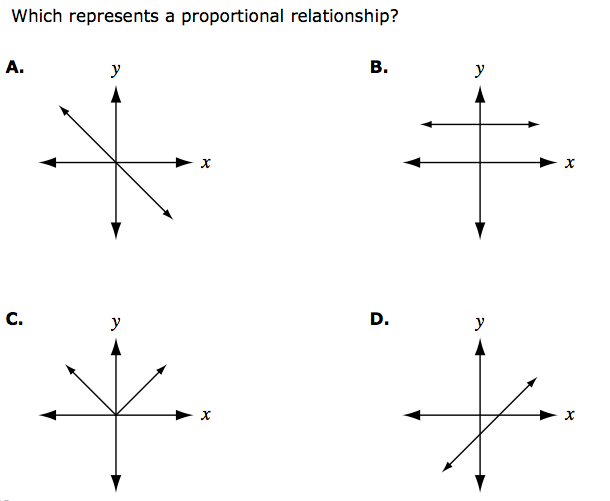
Correct answer: A
Taken from MCA Math Grade 7 Item Sampler
- Which represent a proportional relationship?
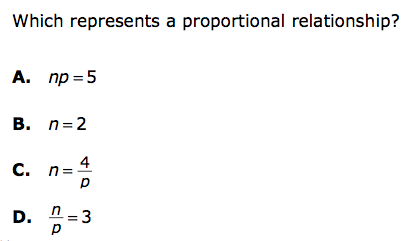
Correct answer: D
Taken from MCA Math Grade 7 Item Sampler
*The next four examples are from, Cramer, K. & Post, T. (1993, May)."Connecting Research to Teaching Proportional Reasoning." Mathematics Teacher, 86(5), 404-407.
- Missing value speed: Lisa and Rachel drove equally fast along a country road. It took Lisa 6 minutes to drive 4 miles. How long did it take Rachel to drive six miles?
Answer: 9 minutes to drive 6 miles.
- Numerical comparison scaling: Anne and Linda are using different road maps of the city. On Anne's map a road 3 inches long long is really 15 miles long. On Linda's map a road 9 inches long is really 45 miles long. Who is using the larger city map?
a) Anne
b) Linda
c) their maps are the same
d) not enough information to tell
Answer: Choice C
- Qualitative prediction mixture
If Nick mixed less lemonade mix with more water than he did yesterday, his lemonade drink would taste
a) stronger
b) weaker
c) exactly the same
d) not enough information to tell
Answer: Choice B
- Qualitative comparison density
Two friends hammered a line of nails into different boards. Bill hammered more nails than Greg. Bill's board was shorter than Greg's. On which board are the nails hammered closer together?
a) Bill's board
b) Greg's Board
c) their nails are spaced the same
d) Not enough information to tell
Answer: Choice a
Differentiation
- limit choices in assessment to 2 or 3
- provide calculators for all computational problems
- make sure if comparing different graphs, the scales are the same on them
- work with partners that are more fluent in the process to provide constant support
- Use a concept map (and other graphic organizers)
- clarify definition of 'table' in this context
- Use a concept map (and other graphic organizers)
- Students can extend the thinking about representation of proportional relationship to explore non-proportional relationships and compare the two.
Parents/Admin
Administrative/Peer Classroom Observation
Students are: | Teachers are: |
making tables of proportional situations | this standard is focusing on the representation (graphical, tabular, verbal) of the situation. |
making graphs of proportional situations | making sure students know what the characteristics of a table, graph, or equation of a proportional relationship look like. |
finding missing values from these two representations (tables and equations) | asking students "how can you tell whether the set of data is proportional by examining a table? an equation? a graph?" |
making the transition from tabular, graphical, and verbal representations, translating between the three | having students calculate the unit rate (slope) from all of the different representations of a proportional relationship. |
making pattern generalizations |
|
calculating unit rates (slope) |
|