9.2.1C Rate of Change & Translations
Make qualitative statements about the rate of change of a function, based on its graph or table of values.
For example: The function f(x) = 3x increases for all x, but it increases faster when x > 2 than it does when x < 2.
Determine how translations affect the symbolic and graphical forms of a function. Know how to use graphing technology to examine translations.
For example: Determine how the graph of f(x) = |x - h| + k changes as h and k change.
Overview
Standard 9.2.1 Essential Understandings
The concept of function is one of the most important ideas in school mathematics. Functions are a way to study the relationship among two or more variables and organize the world. The definition of a mathematical function developed over a thousand years. The beginning focus was on the covariation of two variables. Studying how two variables change together constitutes much of the middle and secondary curriculum. As the definition of function evolved the "exactly one" feature of the function gained importance. This feature is highlighted when students are asked to distinguish between relations that are functions and those that are not.
In elementary school, students begin to study functions by finding rules for various patterns. The rule for determining the number of toothpicks in a figure is a function relating the figure number (independent variable) with the number of toothpicks in that figure (dependent variable).
|
|
|
|
figure number | 1 | 2 | 3 |
number of toothpicks in figure | 5 | 10 | 15 |

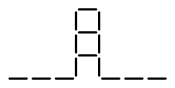
Students explain that the number of toothpicks is the figure number multiplied by five.
Thinking of functions as rules that generalize patterns is developed further in middle school where students learn that a proportional relationship between two variables exists if the rule relating the variables is written as y = m • x. They also can see this relationship graphically as a line passing through the origin. At the end of middle school, students are able to distinguish between linear functions and functions that are not linear by inspecting the function represented by a table, graph, equation, or a real-world situation.
Students at the secondary level use their knowledge of how linear functions change and relate it to how exponential and quadratic functions change. Among the functions that students study in high school is the rate of change as shown in tables, graphs, and equations, one of the most important features that distinguish the different types. Parts of the curves of quadratic and exponential functions can appear to be similar on a graph, but the differences in the rates of change show that no quadratic or exponential will ever match at more than just a few discrete points. Quadratic functions and exponential functions can both increase at an increasing rate but these patterns of change are quite different.
Functions are tools that people use to model relationships between two variables. In middle school students use linear functions to model real-world situations. The function W(t) = 1.5t + 7 could represent to weights of baby girls when they are t months old. Students learn how special features of the function relate to the real-world situation. The y-intercept represents the weight of the baby girl at birth, while the slope represents the number of pounds that the baby gains each month. In addition, the domain of the function is determined by the constraints of the real-world setting. Theoretically, the domain of any linear function could be the set of real numbers, but practically the function does not really make sense for values of t that are less than 0 months or larger than 6 months.
In high school students are expected to identify theoretical and practical domains for a variety of functions. In particular, students in secondary school will focus on the special features of quadratic, exponential, and reciprocals of linear functions. These special features provide insights into the real-world situation being modeled. The vertex of a quadratic function could be used to find the maximum or minimum value of the dependent variable while the asymptote of an exponential function could be used to describe the long-term behavior of a situation. Students in high school need to make connections among equations, graphs, tables, and real-world situations of a variety of functions at the high school level. Each representation provides insights into how student make sense of these functions.
Once students are able to identify important features of a variety of functions then they move to seeing how functions can be transformed. Initially students see graphs of functions as a collection of individual points and then move to seeing the graph as an object itself made up of an infinite number of points. Students initially graph functions like f(x) = (x + 3)2 and g(x) = x + 2 by calculating points to put in a table, then using these points to create a graph. The more points they create the better the graph looks. They then learn to identify the intercepts and, if applicable, the vertex. This process reinforces the notion of a graph as a collection of a finite set of points. Eventually students are asked to combine functions to create new functions (i.e. find h(x) = f(x) + g(x) or k(x) = g(f(x))). These operations and compositions of functions force students to think of the functions themselves as objects. Students need to view the graphs of functions as objects when they are asked to explain how the graph of a function f(x) compares with the graph of the function m(x) where m(x) = f(x) + 5 or the graph of p(x) where p(x) = f(x + 7). Students at the high school level need to see that a vertical translation is the sum of the original function, and a constant function and a horizontal translation is a composition of the original function with a linear function that has a slope of one; i.e., the graph of the function w(x - 11) is a horizontal translation of the graph of w(x) 11 units to the right.
In high school students gain experience distinguishing among different types of functions and sort them into families. Students learn to identify key features of each type using graphs, tables, equations, and real-world situations. The students then begin to perform operations using the functions themselves as inputs. The results of these operations allow students to create new types of functions that can be used to solve new problems.
9.2.1.1
Understand the definition of a function. Use functional notation and evaluate a function at a given point in its domain.
9.2.1.2
Distinguish between functions and other relations defined symbolically, graphically or in tabular form.
9.2.1.3
Find the domain of a function defined symbolically, graphically or in a real-world context.
9.2.1.4
Obtain information and draw conclusions from graphs of functions and other relations.
9.2.1.5
Identify the vertex, line of symmetry and intercepts of the parabola corresponding to a quadratic function, using symbolic and graphical methods, when the function is expressed in the form f(x) = ax2 + bx + c, in the form f(x) = a( x - h)2 + k , or in factored form.
9.2.1.6
Identify intercepts, zeros, maxima, minima and intervals of increase and decrease from the graph of a function.
9.2.1.7
Understand the concept of an asymptote and identify asymptotes for exponential functions and reciprocals of linear functions, using symbolic and graphical methods.
9.2.1.8
Make qualitative statements about the rate of change of a function, based on its graph or table of values.
9.2.1.9
Determine how translations affect the symbolic and graphical forms of a function. Know how to use graphing technology to examine translations.
Benchmark Group C - Rate of Change and Translations
9.2.1.8
Make qualitative statements about the rate of change of a function, based on its graph or table of values.
9.2.1.9
Determine how translations affect the symbolic and graphical forms of a function. Know how to use graphing technology to examine translations.
What students should know and be able to do [at a mastery level] related to these benchmarks
- Students will be able to compare the rate of change of linear functions, absolute value functions, quadratic functions, exponential functions, sine and cosine functions, etc. at various locations on the graph or by examining a table of values.
- Students will understand how vertical and horizontal translations affect the graph and table of values of a variety of functions - linear, absolute value, quadratic, exponential, sine and cosine, etc.
- Students should be able to calculate the rate of change of a linear function given a graph or a table that has at least two ordered pairs. They should be able to calculate slopes that are positive, negative, zero, or undefined.
- Students should be able to explain where the rate of change of a curve shown on a graph increases, decreases or stays the same. They should also be able to explain whether the rate of change of a curve increases (or decreases) at an increasing or decreasing rate.
- Students should be able to determine that the rate of change of a function is increasing, decreasing, or constant given a table of values. The tables can be well-ordered or not well-ordered.
- Given g(x) = f(x) + k, students should be able to explain the similarities and differences between f(x) and g(x) and further that f(x) was translated vertically by k units resulting in g(x). The sign of k determines the direction of the translation up or down.
- Given m(x) = f(x + h), students should be able to explain the similarities and differences between f(x) and m(x) and further that f(x) was translated horizontally by h units resulting in m(x). The sign of h determines the direction of the translation left or right.
- Students should be able to use graphing technology to study both horizontal and vertical translations. This includes the graphing of a function and its transformed function simultaneously and being able to explain the translation by mapping corresponding points of both functions.
Work from previous grades that supports this new learning includes:
- Students should understand the concept of rate of change, and how to identify the rate of change given the table or the graph of a function
- Students entering grades 9 to 11 should be able to distinguish between functions that are linear and functions that are not using tables, graphs, equations, and real-world situations. (repeated in previous benchmarks)
- Students entering grades 9 to 11 should be able to explain whether a slope of a linear function is positive, negative, or zero. (repeated in previous benchmarks)
- Students should be familiar with the concept of translation of a geometric figure.
NCTM Standards: (those that apply to 9.2.1 are bolded)
(p.296, PSSM) Instructional programs from Pre-K through grade 12 should enable all students to:
1. Understand patterns, relations, and functions. In grades 9-12 all students should
- generalize patterns using explicitly defined and recursively defined functions;
- understand relations and functions and select, convert flexibly among, and use various representations for them;
- analyze functions of one variable by investigating rates of change, intercepts, zeros, asymptotes, and local and global behavior;
- understand and perform transformations such as arithmetically combining, composing, and inverting commonly used functions, using technology to perform such operations on more-complicated symbolic expressions;
- understand and compare the properties of classes of functions, including exponential, polynomial, rational, logarithmic, and periodic functions;
- interpret representations of functions of two variables.
2. Represent and analyze mathematical situations and structures using algebraic symbols. In grades 9-12 all students should
- understand the meaning of equivalent forms of expressions, equations, inequalities, and relations;
- write equivalent forms of equations, inequalities, and systems of equations and solve them with fluency - mentally or with paper and pencil in simple cases and using technology in all cases;
- use symbolic algebra to represent and explain mathematical relationships;
- use a variety of symbolic representations, including recursive and parametric equations, for functions and relations;
- judge the meaning, utility, and reasonableness of the results of symbol manipulations, including those carried out by technology.
3. Use mathematical models to represent and understand quantitative relationships. In grades 9-12 all students should
- identify essential quantitative relationships in a situation and determine the class or classes of functions that might model the relationships;
- use symbolic expressions, including iterative and recursive forms, to represent relationships arising from various contexts;
- draw reasonable conclusions about a situation being modeled.
4. Analyze change in various contexts. In grades 9-12 all students should
- approximate and interpret rates of change from graphical and numerical data.
Common Core State Standards (CCSM)
High School: Functions
F-IF.1. Understand that a function from one set (called the domain) to another set (called the range) assigns to each element of the domain exactly one element of the range. If f is a function and x is an element of its domain, then f(x) denotes the output of f corresponding to the input x. The graph of f is the graph of the equation y = f(x).
F-IF.2. Use function notation, evaluate functions for inputs in their domains, and interpret statements that use function notation in terms of a context.
F-IF.4. For a function that models a relationship between two quantities, interpret key features of graphs and tables in terms of the quantities, and sketch graphs showing key features given a verbal description of the relationship. Key features include: intercepts; intervals where the function is increasing, decreasing, positive, or negative; relative maximums and minimums; symmetries; end behavior; and periodicity.★
F-IF.5. Relate the domain of a function to its graph and, where applicable, to the quantitative relationship it describes. For example, if the function h(n) gives the number of person-hours it takes to assemble n engines in a factory, then the positive integers would be an appropriate domain for the function.★
F-IF.6. Calculate and interpret the average rate of change of a function (presented symbolically or as a table) over a specified interval. Estimate the rate of change from a graph.★
F-IF.7. Graph functions expressed symbolically and show key features of the graph, by hand in simple cases and using technology for more complicated cases.★
- Graph linear and quadratic functions and show intercepts, maxima, and minima.
- Graph square root, cube root, and piecewise-defined functions, including step functions and absolute value functions.
- Graph polynomial functions, identifying zeros when suitable factorizations are available, and showing end behavior.
- (+) Graph rational functions, identifying zeros and asymptotes when suitable factorizations are available, and showing end behavior.
- Graph exponential and logarithmic functions, showing intercepts and end behavior, and trigonometric functions, showing period, midline, and amplitude.
F-IF.8. Write a function defined by an expression in different but equivalent forms to reveal and explain different properties of the function.
- Use the process of factoring and completing the square in a quadratic function to show zeros, extreme values, and symmetry of the graph, and interpret these in terms of a context.
- Use the properties of exponents to interpret expressions for exponential functions. For example, identify percent rate of change in functions such as $y=(1.02)^{t}$, $y=(0.97)^{t}$, $y=(1.01)^{12t}$, $y=(1.2)^{\frac{t}{10}}$, and classify them as representing exponential growth or decay.
F-BF.1. Write a function that describes a relationship between two quantities.★
- Determine an explicit expression, a recursive process, or steps for calculation from a context.
- Combine standard function types using arithmetic operations. For example, build a function that models the temperature of a cooling body by adding a constant function to a decaying exponential, and relate these functions to the model.
F-LE.1. Distinguish between situations that can be modeled with linear functions and with exponential functions.
- Prove that linear functions grow by equal differences over equal intervals, and that exponential functions grow by equal factors over equal intervals.
- Recognize situations in which one quantity changes at a constant rate per unit interval relative to another.
- Recognize situations in which a quantity grows or decays by a constant percent rate per unit interval relative to another.
F-LE.2. Construct linear and exponential functions, including arithmetic and geometric sequences, given a graph, a description of a relationship, or two input-output pairs (include reading these from a table).
F-LE.3. Observe using graphs and tables that a quantity increasing exponentially eventually exceeds a quantity increasing linearly, quadratically, or (more generally) as a polynomial function.
F-LE.5. Interpret the parameters in a linear or exponential function in terms of a context.
Misconceptions
Student Misconceptions and Common Errors
- Students mistake the rate of change for the y-intercept in a linear function, or extrapolate that concept to include the constant c in the standard form of a quadratic equation (y = ax2 + bx + c)
- Students confuse translations with other transformations previously studied (i.e. rotations, reflections, etc.)
- Students move translations in the opposite direction (i.e., believe that f(x) = (x + 3) is a translation of 3 units to the right rather than to the left).
Vignette
In the Classroom
- The following vignette describes a classroom where the teacher noticed that her students were having trouble accurately describing how the rate of change shown in a graph is related to the action involved in a real-world situation. Many students struggle with connecting a mathematical model with the real-world situation that is modeled. The teacher takes time to observe what her students are doing and then is able to structure a discussion based on their work. The teacher brings out incorrect answers so that students can exchange points of view and defend their answers. Much of the incorrect answers provided by the students is based on good but incomplete reasoning.
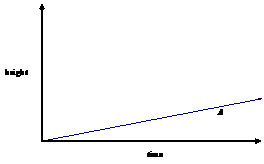
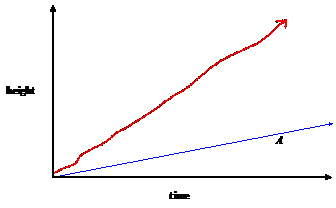
Each student has a copy of the graph below and the teacher is displaying the graph on her whiteboard.
Teacher: This graph represents the height of the water in a wide jar that is being filled up over time. Suppose water is poured into a narrow jar at the same rate. Sketch a graph of what you think the relationship between the height of the water and time would be for the narrow jar. The teacher walks around the room and observes the sketches the students are making. She mentally sorts the sketches the students in the room into three categories. After five minutes she asks her students to comment on the sketches they made. Teacher: Rhonda, will you place your sketch under the document camera so eveyone can see your graph and explain how your sketch matches the filling of a narrower jar.
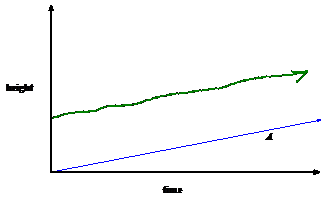
Rhonda's Sketch Rhonda: Both the narrow jar and the wide jar fill up at the same rate but I know that the narrow jar will always be higher since it takes more to fill the wide jar. Teacher: Does anyone have any questions for Rhonda about her graph? Paul: My graph is different. Teacher: What comments do you have about Rhonda's sketch? Paul: Rhonda, your sketch shows that at time zero the narrow cup has water in it already. Both sketches need to show that the glasses are empty when they start. My graph shows that both jars are empty when the water is poured.
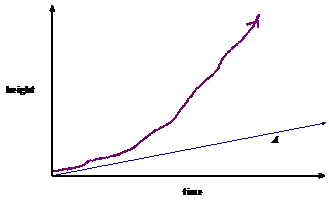
Paul's Sketch Paul: I know from experience that when you pour water into a narrow glass that it starts out slow then fills up fast at the end, that is why my sketch goes up like a curve. Jaz: I know what you are saying. When I fill my soda cup at the theater I always spill because it comes out so fast at the end. Teacher: I understand what you are saying about Paul's sketch but I notice that Jenna's sketch is different. Jenna: I think Paul's is correct. Teacher: Why don't you just show your sketch anyway.
Jenna's Sketch Jenna: I also started the height at zero when time was zero because I knew the narrow cup was empty when it started. My graph shows that the height of the narrow cup grows at a constant rate over time which does not match what Paul is saying, so I think Paul is right. Teacher: What is happeing to the height of the water in the wide jar as time increases? Jenna: It goes up. Wait, it goes up at a constant rate and does not get faster and faster. I think maybe I am right. If the height of the water goes up at a constant rate in the wide cup, then it probably goes up at a constant rate in the narrow cup as well. I am going to say that Paul's graph is wrong and mine is right. Paul: I think that something crazy happens when you fill up narrow cups. Teacher: Is that what you learned in science class? Paul: No, just at home. Jaz: I think Jenna is correct because what if you had a wider jar than the wide jar. The height would also probably go up at a constant rate. Teacher: On your graph, please sketch another graph that shows how the height of an even wider jar than the original grows over time. The teacher checks for understanding of the whole class by walking around and watching the students. She checked to make sure that the third sketch was a line that passes through the origin and has a positive slope that is less than the original graph. Paul insists on testing his theory so the teacher carries out an experiment in class using three glasses that vary in width. The data confirms that Jenna's sketch models the height accurately. |
Resources
- Growth Rate
This lesson allows students to approximate rate of change from growth rate charts.
- Pedal Power
This lesson helps students understand slope as a rate of change.
Additional Instructional Resources
9.2.1.9 A Transformations Quiz (uses TI nspire)
This activity combines both algebraic and graphical representations of transformations of any parent graph. The students are required to view an algebraic equation, list its parent graph, describe its transformations, and then graphically represent the equation by showing both the parent graph and its final transformation. It is a very flexible activity that can be easily edited.
9.2.1.9 Transformation - Vertical and Horizontal Shifts
Through exploration, students will discover the rules of vertical and horizontal shifts on functions. In this activity, students will be using the parent functions of quadratic, cubic, absolute value and square root.
9.2.1.9 Transformations of Absolute Value Functions
In this activity, students explore transformations of absolute value functions by examining graphs of families of functions. Students will recognize patterns and make predictions about transformations of absolute value functions.
9.2.1.9 Transformations of the Graph of a Function (uses TI nspire)
Using the TI-NspireTM, students will alter the constants in the general equation of a function and compare the effect on the graph relative to the parent function. The file contains a few self-assessment questions for the students to check their understanding of the concept.
- Vertical translation
- Horizontal translation
Professional Learning Communities
Reflection - Critical Questions regarding the teaching and learning of these benchmarks
- Are my students able to connect the features of a graph with the features of a real-world situation?
- How should I structure whole class discussions that build meaning of ideas based on student to student conversations?
- How do I structure the presentation of student work in the share summary phase of my lesson?
Materials - Suggested articles and books
Developing Essential Understanding of Functions Gr. 9-12 (NCTM, 2010)
Focus in HS Mathematics: Reasoning and Sense Making in Algebra (NCTM, 2010)
References
Common Core State Standards (http://www.corestandards.org/the-standards/mathematics)
Ruddell, M.R., & Shearer, B.A. (2002). Middle school at-risk students become avid word learners with the vocabulary self-collection strategy (VSS). Journal of Adolescent & Adult Literacy, 45, 352-363.
Assessment
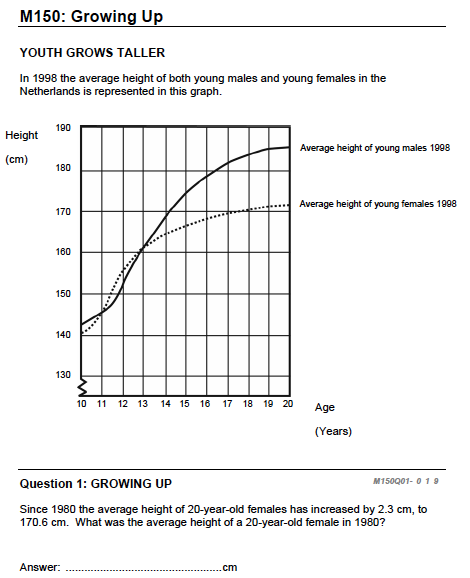
Example Item 1
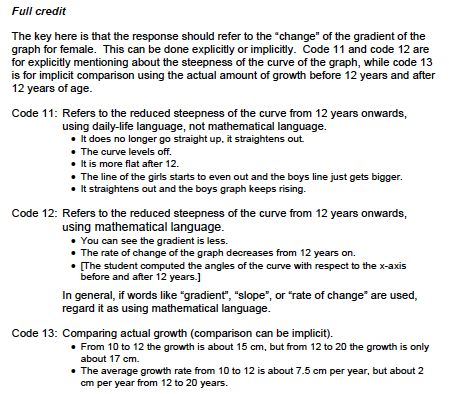
Correct Answer: 168.3 cm
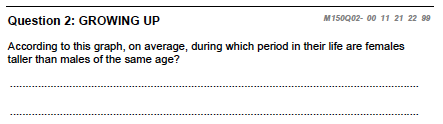
Correct Answer: 11 to 13 years of age.
Correct Answer:
Cognitive Level: Application, Analysis, Synthesis and Evaluation Source: Programme for International Student Assessment (PISA) released item - M150
| ||||||||||
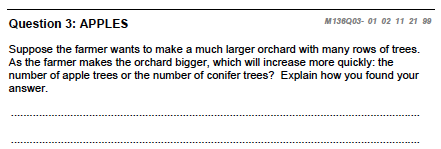
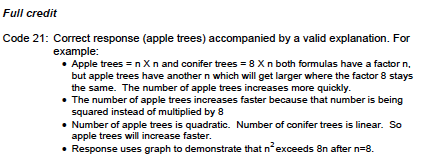
Example Item 2
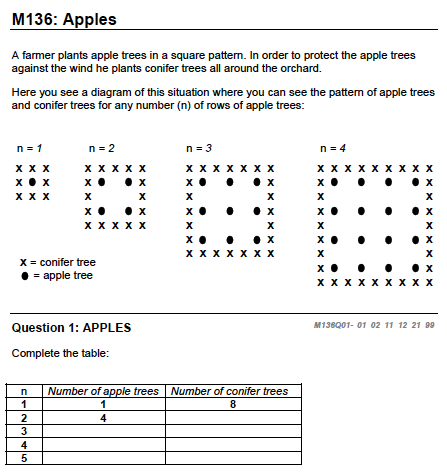
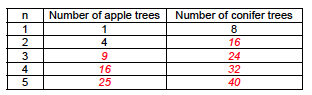
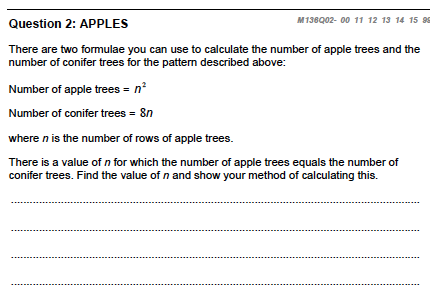
Correct Answer:
Correct Answer: n = 8
Correct Answer:
Cognitive Level: Application, Analysis, Synthesis and Evaluation Source: Programme for International Student Assessment (PISA) released item - M136
| ||||||||||
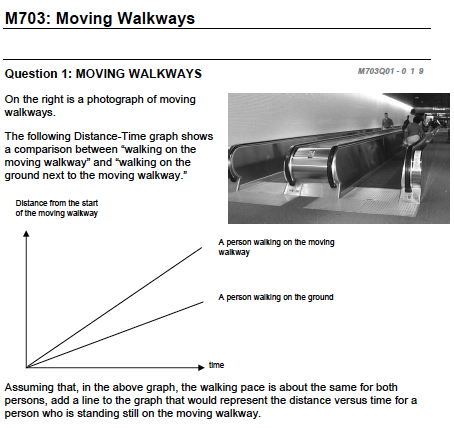
Example Item 3
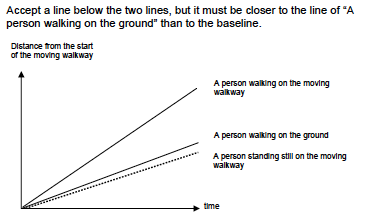
Correct Answer:
Cognitive Level: Application, Analysis, Synthesis and Evaluation Source: Programme for International Student Assessment (PISA) released item - M703
| ||||||||||
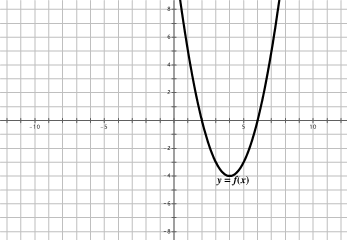
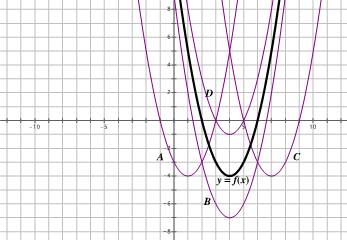
Example Item 4 Consider the graph y = f(x) shown on the graph below.
Select among the six functions defined below and label the four graphs below. Justify your selections.
Cognitive Level: Application, Analysis, Synthesis and Evaluation Source: Developing Essential Understanding of Functions - Grades 9-12 (p. 103), NCTM 2010 Correct Answer:
Justifications need to be assessed as well. |
Differentiation
The use of graphing utilities can help students with special needs to visualize the changes that various translations make in the graph of a function.
SpEd students with language and/or information processing difficulties and ELL students benefit from the use of vocabulary development, guided notes, concept maps, and other graphic organizers when integrated with mathematics instruction. Teachers can find an excellent resource in the use of these tools in mathematics in the following:
Barton, M. L., & Heidema, C. (2002). Teaching reading in mathematics: A supplement to teaching reading in the content areas teacher's manual. (2nd ed.). Aurora, CO: Mid-continent Research for Education and Learning.
Zike, D. (2003). Dinah Zike's big book of math for middle school and high school. San Antonio, TX: Dinah-Might Adventures, LP. (www.dinah.com)
- Use as many non-linguistic approaches as possible - demonstrations, manipulatives, pictures, etc. Have students create their own math dictionaries including definitions they create, pictures, and examples of the terms. Promote the use of the Frayer model, Verbal/visual maps, graphic organizers, and foldables to make sense of new vocabulary. Having a word wall in the math classroom to refer to can be helpful.
Resources for teachers of English Language Learners in Math:
Echevarria, J. J., Vogt, M. E., & Short, D. J. (2009). The SIOP model for teaching mathematics to English learners. Columbus, OH: Allyn & Bacon.
Kersaint, G., Thompson, D. R., & Petkova, M. (2009). Teaching mathematics to English language learners. New York: Routledge.
Texas State University System. (2004). Mathematics for English language learners. Retrieved from http://www.tsusmell.org/ .
This website includes online teaching videos showing best practices along with a classroom lesson bank.
Extending the Learning
Use of technology resources can allow students to explore and extend their understandings; online activities can provide extensions on concepts.
Parents/Admin
Administrative/Peer Classroom Observation
Students are: | Teachers are: |
relating mathematical models with the real-world situations they represent. | providing students with opportunities to make connections between the models and the situation. |
talking to each other during whole class discussions. | giving students tasks that ask them to make sense of situations. structuring student presentations so that they dominate certain discussions. |
Parent Resources
Interactivate
This web site provides java applets that allow students to investigate mathematical ideas in dynamic ways.
References
Bush, W.S. (Ed.). (2000). Mathematics assessment: Cases and discussion questions for grades 6-12.
Bush, W. S., & Greer, A. S. (Eds.). (1999). Mathematics assessment: A practical handbook for grades 9-12.
National Council of Teachers of Mathematics. (2010). Developing essential understandings of functions - Grades 9-12. Reston, VA: NCTM.
See Why the Graph Breaks in NCTM's Mathematics Assessment: Cases and Discussion Questions for Grades 6-12 (p. 24-27; teacher notes on p. 100-102).
See The Golf Shot in NCTM's Mathematics Assessment: A Practical Handbook for Grades 9-12 (p. 123).