8.4.1 Scatterplots, Lines of Best Fit, and Predictions
Collect, display and interpret data using scatterplots. Use the shape of the scatterplot to informally estimate a line of best fit and determine an equation for the line. Use appropriate titles, labels and units. Know how to use graphing technology to display scatterplots and corresponding lines of best fit.
Use a line of best fit to make statements about approximate rate of change and to make predictions about values not in the original data set.
For example: Given a scatterplot relating student heights to shoe sizes, predict the shoe size of a 5'4" student, even if the data does not contain information for a student of that height.
Assess the reasonableness of predictions using scatterplots by interpreting them in the original context.
For example: A set of data may show that the number of women in the U.S. Senate is growing at a certain rate each election cycle. Is it reasonable to use this trend to predict the year in which the Senate will eventually include 1000 female Senators?
Overview
Standard 8.4.1 Essential Understandings/Ideas
In this standard, students are using what they know about linear relationships to model the trend in a set of data. This linear model allows students to make predictions between and beyond the given data points. It is essential for students to be able to draw a line of best fit and assess the appropriateness of the fit. Students will not only use that line to make predictions, but also write the equation for this line of best fit. Students will also interpret and assess the appropriateness of the rate of change and y-intercept in the equation as it relates to the context of the problem and the data set. Graphing technologies are extremely helpful for students to understand the big idea of “best fit”. The graphing technologies allow students to test different lines and compare their best fit line to the actual regression line. This also allows students to focus their time on the application of the line that is drawn through the data. They can use the line to make predictions and draw conclusions about the data set.
Benchmark Group A - Scatterplots, Lines of Best Fit, and Predictions
- 8.4.1.1 Collect, display and interpret data using scatterplots. Use the shape of the scatterplot to informally estimate a line of best fit and determine an equation for the line. Use appropriate titles, labels and units. Know how to use graphing technology to display scatterplots and corresponding lines of best fit.
- 8.4.1.2 Use a line of best fit to make statements about approximate rate of change and to make predictions about values not in the original data set.
- For example: Given a scatterplot relating student heights to shoe sizes predict the shoe size of a 5’4” student, even if the data does not contain information for a student of that height.
- 8.4.1.3 Assess the reasonableness of predictions using scatterplots by interpreting them in the original context.
- For example: A set of data may show that the number of women in the U.S. Senate is growing at a certain rate each election cycle. Is it reasonable to use this trend to predict the year in which the Senate will eventually include 1000 female Senators?
What students should know and be able to do [at a mastery level] related to these benchmarks.
- Students will be able to collect data and display the data on a scatterplot using appropriate titles, labels, and units.
- Students will interpret data on a scatterplot.
- Based on the information given, students will draw an approximate line of best fit (graph model) and write the equation for their approximate line of best fit.
- Students will then use the line (graph model) and/or the equation to make predictions about the situation for data that has not been collected. They will also use the graph model to give them more information about the original context, allowing them to describe the approximate rate of change and interpret the reasonableness of their solutions.
- Students will use graphing technology to display data and the actual best-fit line.
Work from previous grades that supports this new learning includes:
- Students can plot pairs of positive and negative rational numbers on a coordinate grid and appropriately label the x and y-axes.
- Students can write an equation given two points
- Students have developed an understanding of proportional relationships
- Students have graphed proportional linear relationships, and have experience with the meaning of, and graphical representation of, a constant rate of change.
NCTM Standards:
- Use graphs to analyze the nature of changes in quantities in linear relationships.
- Explore relationships between symbolic expressions and graphs of lines, paying particular attention to the meaning of intercept and slope.
- Use symbolic algebra to represent and explain mathematical relationships.
- Approximate and interpret rates of change from graphical and numerical data.
Data Analysis & Probability 6-8
- Select, create, and use appropriate graphical representations of data, including histograms, box plots, and scatterplots.
- Make conjectures about possible relationships between two characteristics of a sample on the basis of scatterplots of the data and approximate lines of fit.
CCSS:
Statistics and probability 8.SP
Investigate patterns of association in bivariate data.
8.SP.1 Construct and interpret scatter plots for bivariate measurement data to investigate patterns of association between two quantities. Describe patterns such as clustering, outliers, positive or negative association, linear association, and nonlinear association.
8.SP.2 Know that straight lines are widely used to model relationships between two quantitative variables. For scatter plots that suggest a linear association, informally fit a straight line, and informally assess the model fit by judging the closeness of the data points to the line.
8.SP.3 Use the equation of a linear model to solve problems in the context of bivariate measurement data, interpreting the slope and intercept. For example, in a linear model for a biology experiment, interpret a slope of 1.5 cm/hr as meaning that an additional hour of sunlight each day is associated with an additional 1.5 cm in mature plant height.
Misconceptions
- Students will often times only chose data points that are plotted on the graph in order to find the line of best fit. Sometimes this will work because their line will go through two of the original data points. However, often times the line may NOT go through any of the data points and students still pick only the plotted points.
- Students think the line of best fit must go through (0,0). This is sometimes true, but students need to be able to understand what the y-intercept means in the situation and determine if it makes sense given the situation.
- Students often lose the meaning of the rate of change and don’t connect it back to the context and variables in the problem.
- When trying to decide correlation of a data set students will sometimes have confusion about whether there is positive, negative, or no correlation.
Vignette
Student: Why does the line of best fit not always touch as many points as possible on a scatter plot?
Mentor: A line of best fit is often useful to attempt to represent data with the equation of a straight line in order to predict values that may not be displayed on the plot. The line of best fit is determined by the correlation between the two variables on a scatter plot. In the case that there are a few outliers (data points that are located far away from the rest of the data) the line will adjust so that it represents those points as well.
Student: But why does it need to include outliers if most of the data is in one area of the scatter plot?
Mentor: A line of best fit represents ALL of the data in a scatter plot so it must include the outliers in order to be an accurate representation.
Student: Well, how do I know where to draw the line of best fit when the data includes outliers?
Mentor: It is not too hard to make a close guess if you take some time to look at the data. First, plot (1,2) (2,3) and (3,4). How do you think the line of best fit for this data will look?
Student: The line of best fit will touch all of those points because those points make a straight line. The line will go upwards and it will have a slope of 1.
Mentor: That is right. The line of best fit crosses through all of the data points just like you said. However, if you add the point (9,3) what do you think will happen?
Student: I think that the line will adjust so that it will be less steep. It will not touch all of the data points..
Student: I think it would look something like this:
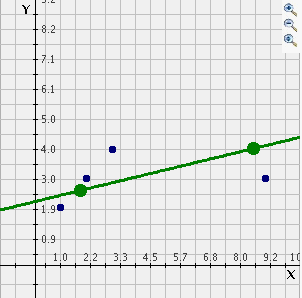
Mentor: Now you can check how close your guess is by (use ILLUMINATIONS Line of Best Fit Tool) That is very close! You can compare the equations to see how close you were as well. The equation for your estimated line of best fit is in green and the equation for the true line of best fit is in red. This program could be fun to use to experiment with what could happen with outliers in different places on the scatter plot or by plotting more dots in one area.
Student: Cool! Now I understand how to draw lines of best fit more accurately and I know what to keep in mind when there is an outlier.
(taken from the InterActivate Website)
Resources
Teacher Notes
- It is helpful to use uncooked spaghetti noodles for students to practice fitting lines. This allows students to make their fit better by moving the spaghetti rather than having to erase and redraw.
- Students do not realize that they need to pick two points ON the line to calculate the equation of the line of best fit and it is OK if those points are not part of the original data set.
- Focus on the basic idea that a line is drawn to represent the data pattern well. Will it help make a good prediction. Avoid the temptation to use “rules” like “join the first and last point” or “go through the maximum number of points” or “have equal number of points above and below the line”. (Taken from page 167 teachers book of Core Plus Mathematics Course 1)
- Use technology to graph different equations for the same set of data. This will help show different line models drawn in the data and allows students to see how little differences in the line can make big differences in using the line for predictions. Use CPMP tools for a database of scatterplots that give students opportunity to practice finding the line of best fit and comparing it to the actual regression line. This tool provides students with many different sets of data instantly without having to type in all the data.
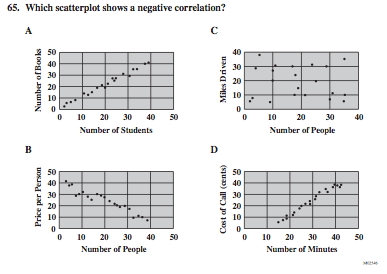
- Give students a variety of data sets so that they have a chance to practice fitting lines that should go through the origin as well as lines that have a y-intercept other than zero.
- Sometimes the line of best fit can be referred to as a trend line or linear regression. Teachers should make reference to both vocabulary terms to avoid confusion in future mathematics courses.
- Some examples of formats that can be used to graph a scatterplot and the line of best fit include graphing calculators, excel, CPMP tools, ILLUMINATIONS line of best fit tool
- Students who have difficulty understanding how to interpret correlation have often lost sight of the presence of both variables because they tend to think about correlation as one thing. Emphasize for them that there are two directions that each variable can move. Positive correlation is when the second variable moves in a positive direction as the first variable moves in a positive direction. The positive correlation also requires that the second variable moves in a negative direction as the first variable moves in a negative direction. Highlight the qualitative rather than the quantitative characteristics before using real data.
- There are some informal methods for estimating where the line of best fit on a scatterplot should be drawn - the area method and the dividing method. Here is a website that models both methods.
- Another method called the “media-median” method.
Illuminations: Line of Best Fit Tool gives kids practice and then compares their guess to the actual Least Squared Regression Line. Line of Best Fit Practice also allows you to import data
LESSON :Exploring Linear Data Gives kids a chance to look at three different data sets and practice the process of finding the line of best fit.
Lesson: BARBIE BUNGEE In this lesson, students model a bungee jump using a Barbie® doll and rubber bands. The distance to which the doll will fall is directly proportional to the number of rubber bands, so this context is used to examine linear functions. There are also links to other resources such as assessment options, extensions, reflections and so on.
Additional Instructional Resources
m & m bungee experiment where students collect data, plot the data, draw the line of best fit, calculate the equation of the line of best fit, and use the equation to predict other values. student sheet and teacher resource
An idea of data collection of arm span and height. Allows students to make predictions and determine the reasonableness of the prediction.
Free Download that goes with the Core Plus curriculum CPMP Tools Great tool to get a lot of data and practice drawing lines of best fit. (A free software download)
A website showing two different methods for informally estimating the line of best fit on a scatterplot - 1) area method 2) dividing method
This Concept Development Lesson is based on the skills needed to determine the line best fit for a set of data. The focus is based on grade levels 7-12. Students will review basic graphing skills, and constructing scatter plots. They will identify the relationships that are presented by the data on the scatter plot. This knowledge will guide them in understanding how to identify a line of best fit for different data sets. (Includes answer keys)
- scatterplot - The graph of a collection of ordered pairs that allows an exploration of the relationship between the points.
- line of best fit - The line that best represents the trend that the points in a scatter plot follow. Also known as regression line or trend line.
- correlation - A measure of the relationship between two variables. There are three possibilities when talking about correlation - positive correlation (y tends to increase as x increases), negative correlation (y tends to decrease as x increases) and no correlation (when x and y are not related).
Reflection – Critical Questions regarding the teaching and learning of these benchmarks
- What should I change from my current instruction to meet these learning goals?
- How will I engage students in these lessons?
- What can I do to keep the students engaged when making a scatterplot?
- Am I making sure the student are connecting the rate of change and y-intercept of the line of best fit back to the real world meaning of the problem or are they just “calculating” numbers?
- What method works best with my students for writing the equation of a line?
- Do the tasks I’ve designed connect to underlying concepts or focus on memorization?
- How can I tell if students have reached this learning goal?
- How should I differentiate the lesson?
- Were students able to explain the meaning of the slope and y-intercept within the context of this problem?
Bungee m&m's. (n.d.). Florida Center for Instructional Technology. Retrieved June 17, 2011
CPMP-Tools Software. (n.d.). Western Michigan University | A top 100 national university. Retrieved June 17, 2011
California High School Exit Examination. (n.d.). California Department of Education. Retrieved June 17, 2011
How do I construct a straight line through data points? (n.d.). The Math You Need, When You Need It. Retrieved June 17, 2011
Illuminations: Welcome to Illuminations. (n.d.). Illuminations: Welcome to Illuminations. Retrieved June 17, 2011
Interactivate: Line of Best Fit. (n.d.). Shodor: A National Resource for Computational Science Education. Retrieved June 17, 2011
Line of Best Fit. (n.d.). National Security Agency Central Security Service. Retrieved June 17, 2011
Picciotto, H. (n.d.). The Median-Mean Line. Henri Picciotto's Math Education Page. Retrieved June 17, 2011
Principles and standards for school mathematics. (2000). Reston, VA: National Council of Teachers of Mathematics.
Regents Exam Questions A.S.17: Scatter Plots. (n.d.). Jefferson Math Project. Retrieved June 17, 2011
Roberts, D. (n.d.). Regression Activity - Arm Span. Oswego City School District Regents Exam Prep Center. Retrieved June 17, 2011
Schielack, J. F. (2010). Focus in grade 8: teaching with curriculum focal points.. Reston, VA: National Council of Teachers of Mathematics.
Teachers Network: Empowering English Language Learners: Using Scatter Plots to Predict the Future: Miguel Pineda. (n.d.). Teachers Network. Retrieved June 17, 2011
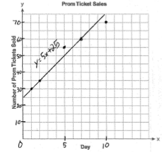
Assessment
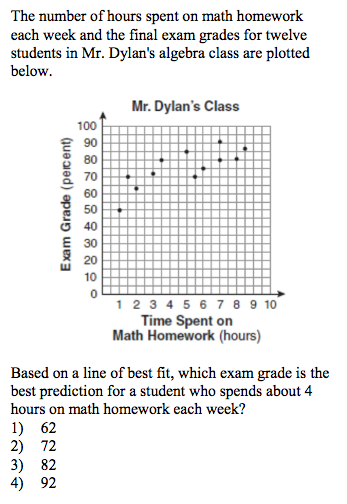
Correct answer: 2
Taken from Regents Exam Prep Questions: ScatterPlots

Correct answer: 4
Taken from Regents Exam Questions A.S.8: Scatter Plots

Possible Graphical Answer

From MN MCA III 8th grade item sampler Correct answer: B
taken from this site
Correct Answer: B
Differentiation
What is the focus? Creating the scatterplot, drawing the line of best fit or finding the equation? Separate the skills so they are not doing both at once?
The lessons could use visual aids such as transparencies, overhead graphing calculator, and LCD projector. In addition, questions asked to collect data could explore relationships that are meaningful to language learners. For example, does bilingualism help me to be a better student? Does educational level predict future earnings? Before collecting data, students should be encouraged to create their own survey questions and practice speaking skills by asking the questions to members of the school community. See this site.
Students can look at how changing the scale on a scatterplot can change how the graph can go from appearing linear to appearing more “spread out”.
In addition to the standards learning, students can go a step further and look at calculating correlation coefficient of a scatterplot.
Parents/Admin
Administrative/Peer Classroom Observation:
Students Are: (descriptive list) | Teachers Are: (descriptive list) |
Using spaghetti to approximate the line of best fit | Asking students how they know “which lines are a better fit?” |
Estimating a line of best fit and comparing it to the lines of best fit that their classmates estimated | Asking students “Can you draw a better line?” and then having them check with actual regression line. |
Going back to the original context and asking if their rate of change, y-intercept, and prediction are reasonable for the context. | Asking students “Does your prediction (rate of change, y intercept) make sense in the original context of the problem” |
Estimating lines of best fit and comparing to the actual regression line using graphing technology. | Providing students with a variety of data sets with different y-intercepts and rates of change. |
Using two points ON THE LINE (not necessarily the data set) to write the equation of their line of best fit. | Exposing students to many data sets. Some that are obviously linear and the best fit line passes through many points as well as data that is more spread out and the best fit line doesn’t go through any data points. (Reference Vignette for 8.4.1) |
Students are exploring questions between two variables such as: is the shoe size of a man related to his height? Does how long children remain at the lunch table help predict how much they eat? |
|