7.2.1 Proportional Relationships
Understand that a relationship between two variables, x and y, is proportional if it can be expressed in the form $\frac{y}{x}$ = k or y = kx. Distinguish proportional relationships from other relationships, including inversely proportional relationships (xy = k or y = $\frac{k}{x}$).
For example: The radius and circumference of a circle are proportional, whereas the length x and the width y of a rectangle with area 12 are inversely proportional, since xy = 12 or equivalently, y = $\frac{12}{x}$.
Understand that the graph of a proportional relationship is a line through the origin whose slope is the unit rate (constant of proportionality). Know how to use graphing technology to examine what happens to a line when the unit rate is changed.
Overview
Standard 7.2.1 Essential Understandings
Seventh grade students are developing understanding that a function is a relationship between an independent and a dependent variable in which the change in value of the independent variable determines a direct corresponding change in value of the dependent variable.
Seventh grade students will understand that if a relationship is proportional its graph will be a straight line climbing from left to right (has positive slope) and passes through the origin (0, 0). In a tabular representation, the relationship will be shown as a constant rate of change, increasing by the same value all the time. This constant rate of change can be found by dividing the y value by the x value, and comparing them. They will find that all proportional relationships that are represented in a table will have the same quotient (slope) for y/x. The slope of proportional relationships is always the constant factor relating the two quantities. Also, from the written description (in words or equation form), there is a constant rate of change (miles per hour, people per class, etc.). Students will be able to determine the relationship by looking at the pattern in the table, in the written description, or in the graph. This constant rate of change can also be thought of as, 'when x increases by some value, then y also increases by some constant rate.' Likewise, students can 'undo' the process to find the 'k' or constant rate of change, by division (y/x = k).
If seventh grade students are given a real-world situation to analyze, they must be able to determine if the situation is proportional or not. One way to determine if a situation is proportional is the relationship can be illustrated on a coordinate grid with a line passing through the origin and rising from left to right. Another way to determine proportionality is by examining a tabular display to see if all the pairs of y to x values have an equivalent ratio. Finally, a relationship can be determined to be proportional if it can be stated in an equation of y = kx or its equivalent, y/k = x.
7th Grade Focal Points: Students graph proportional relationships and identify the unit rate as the slope of the related line. They distinguish proportional relationships (y/x = k, or y = kx) from other relationships, including inverse proportionality (xy = k, or y = k/x).
All Standard Benchmarks
7.2.1.1
Understand that a relationship between two variables, x and y, is proportional if it can be expressed in the form y/x=k or y=kx. Distinguish proportional relationships from other relationships, including inversely proportional relationships (xy=k or y=k/x). Example: The radius and circumference of a circle are proportional, whereas the length x and the width y of a rectangle with area 12 are inversely proportional, since xy = 12, or equivalently, y = 12/x.
7.2.1.2
Understand that the graph of a proportional relationship is a line through the origin whose slope is the unit rate (constant of proportionality). Know how to use graphing technology to examine what happens to a line when the unit rate is changed.
7.2.1 Proportional Relationships
7.2.1.1
Understand that a relationship between two variables, x and y, is proportional if it can be expressed in the form y/x=k or y=kx. Distinguish proportional relationships from other relationships, including inversely proportional relationships (xy=k or y=k/x). Example: The radius and circumference of a circle are proportional, whereas the length x and the width y of a rectangle with area 12 are inversely proportional, since xy = 12, or equivalently, y = 12/x.
7.2.1.2
Understand that the graph of a proportional relationship is a line through the origin whose slope is the unit rate (constant of proportionality). Know how to use graphing technology to examine what happens to a line when the unit rate is changed.
What students should know and be able to do [at a mastery level] related to these benchmarks:
- Distinguish proportional relationships from other relationships, including inversely proportional relationships (xy = k or y = k/x).
- Students can look at a graph and be able to determine if it is or is not a proportional relationship, and be able to predict what will happen to a line when the unit rate is changed.
- Students should be able to read a verbal description and determine if the relationship is proportional.
- They should also be able to determine if a relationship is proportional from a table of data.
- Students can enter an equation into a graphing calculator and compare different linear graphs, some proportional and some not.
Work from previous grades that supports this new learning includes:
- Graphing in the first quadrant.
- Reading a table.
- Writing equations.
- Interpreting equations.
- Fluency with basic operations.
- Identifying coordinates.
- Making a table.
- Plot points and connect them to form a line.
- Fill in a table for 'input' and 'output' values.
- Graph points given in a table.
- Find equivalent fractions.
- Multiply, simplify and scale up fractions.
- Change in the independent variable leads to change in dependent variable.
- Know the parts of tables and graphs.
- Minimal use of graphing calculators.
NCTM Standards
Represent, analyze, and generalize a variety of patterns with tables, graphs, words, and, when possible, symbolic rules.
Common Core State Standards (CCSS)
Perform operations with ratios and proportional relationships.
7.RP: Analyze proportional relationships and use them to solve real-world and mathematical problems.
7.RP.2. Recognize and represent proportional relationships between quantities.
7.RP.2.a. Decide whether two quantities are in a proportional relationship, e.g., by testing for equivalent ratios in a table or graphing on a coordinate plane and observing whether the graph is a straight line through the origin.
7.RP.2.b. Identify the constant of proportionality (unit rate) in tables, graphs, equations, diagrams, and verbal descriptions of proportional relationships.
Misconceptions
Student Misconceptions and Common Errors
- Students attempt using an additive, not a multiplicative relationship, to create a scaled relationship (students add values to side lengths to get similar figures instead of multiplying by the scale factor).
- When the scalar rate is non-integer (for example, 3.125 times greater), students tend to gravitate towards a "fractional avoidance" strategy and incorrectly attempt to use an additive strategy for scaling, rather than a rational number scalar rate.
- Students use the ratio x/y for slope ratio.
- Students mistakenly think slope is only found on graphs, but slope is a way of describing a constant rate of change that can be graphical, tabular, or symbolic.
- Students mistakenly believe slope of ⅔ is less than slope of 4/6.
- Sometimes students are plotting points incorrectly, switching around the x and y coordinates, or not including the negative sign if there is a negative coordinate.
- Thinking products are always greater than factors (ex. 2 x 2 = 4, 4 > 2, but ½ x ½ = ¼, and ¼ < ½).
- Thinking that all relationships that increase or decrease by a constant value are proportional.
- Misinterpretation of equivalent values/fractions.
- If students are unclear about what they are dividing or what they are trying to find out, they often can get a constant that is not appropriate; they could be satisfied just getting an answer and moving on, not testing the reasonableness of their answer.
Vignette
Proportional Relationship: stacks of books (S--student, T--teacher)
T--"Ok, we've been talking about linear relationships and proportional relationships. Today you can see the 10 stacks of different books I have at the front of the room." (Gather 10 books of several different types from various classrooms; different thicknesses per book is preferable. Each group gets one set of 10 of the same kind of book. Do not use magazines, or if you do, use that as an added topic after the activity is over).
"Let's research our key question: what is the relationship between the number of books in a stack and the height of the stack? If I told you how many of your books are in a stack, can you tell me the height? Or, if I told you the height of your stack of books, can you tell me how many books are in the stack? Your group's task is to find out how tall different stacks of books are. You will need to make a two-column table for number of books and height of the stack. Count from 0 to ten for the number of books. The independent variable will be what? What do we already know?"
S: "The number of books."
T: "Yes. The number of books is the independent variable because the height of the stack depends on the number of books. So height is my dependent variable. Make sure your table starts at 0 books. Your task is to use the same type of book and figure out what different stacks' heights are. Do not take any shortcuts here. I want to know the height of each of the 10 stacks of books."
Students will start measuring using any strategy they want. The teacher is walking around the room questioning and assisting groups of working students.
T: "OK, I notice here that you have 0 cm for 0 book, 3.1cm for 1 book, and 6.3cm for 2 books. Tell me about that."
S: "Well, we took 1 book and measured that. Then we took 2 books and measured how tall those books were. We are going to keep going until we have 10 books' height."
T: "OK. Thanks."
S: Students to one another in their group: "Hmmmm. Maybe we're doing it wrong? How can this be? If one book is 3.1, then shouldn't 2 books be 6.2?"
S3: "Well, we measured them and that's what we got. How about we re-measure, and this time let's have the same person measure, ok?"
After re-measuring, the students get similar data, so continue on using their original method.
Teacher walks around the room. After some time, she hears the following:
S2: "Oh, wow, can't we just take the height of one book, and multiply by whatever number of books we have?"
T--"Why? Why do you think that would work?"
S2: "Because since we are using the same book, they all have the same height. Well, each book is the same height as the others, so we can just multiply. Wow, that is easy!"
T: "But if I would have just told you to do that, would you have understood why? Maybe not. So by actually doing the activity and thinking through it, you have solved the problem. Nice job!"
[1] (to entire class) T: "Ok, class, what did we come up with?"
S1: "Our table has values that go up by the same every time. Like 1 book was 2.2 cm, 2 books was 4.4, 3 books was 6.6 and so on."
S2: "We just graphed the data when we were done. Our table doesn't change by exactly the same value, but our graph is almost a perfectly straight line going up."
T: "Let's talk about the graph. Where does your graph start?"
S2: "At (0,0)."
T: "Why does it start there?"
S2: "Because for 0 books, the height is also 0."
T: "Right. Nice. Who else graphed this? (other groups raise their hands) "Why does your line go up?"
S3: "Because for every book we put on the stack the height will increase."
T: "Right. What can we conclude then about our graphs?"
S1: "That they should all be straight lines that go through the origin, and are rising."
T: "Correct. Now let's talk about the table. One group said the values did not change by exactly the same value. Let me ask this, were you putting the same type of book on every time?"
S2: "Yes."
T: "So let's talk about that. If you were putting the same type of book on the stack every time and the size of the book doesn't change, then what would you say should happen to the height as you increase the number of books on the stack by 1?"
S3: "That the height should always be increasing by the same value."
T: "If that is the case, then why didn't that group's table show that?"
S1: "Measurement error. Someone could've read the tape measure wrong, or the book could have been bent or something to make it seem a little thicker than the others."
T: "Good observations. We all know that if we do an experiment, sometimes conditions aren't perfect. But here again, if I would have just told you that each book is exactly the same, would have we seen this type of error? No, we wouldn't have. This makes for good conversation, and we learn from measuring and counting to see the discrepancies. Back to the problem. Now using your pattern in the table, can we write a rule that would find the height of any stack of books?"
S2-- "Take the height of one book and multiply by the number of books. So our book was only 3.1 cm tall, and so we could just multiply the height of 1 book times the number of books."
T--"That is our rule in words. We need to translate that to an equation with only numbers, variables, and mathematical symbols. Who thinks they have an equation that would work here?"
S3: "We could write h = 3.1n where h is the height of the stack, and n is the number of books in the stack."
T: "Correct. We have a proportional relationship because the height of each book is our constant rate of change, and it increases by the same amount each time we add one book to the stack. So we can say that the height of the stack is 'proportional' to the number of books in the stack. What if i asked you to find the number of books in a stack 46 ½ centimeters tall. How would you do that?"
S2: "We know the height of the stack depends on the number of books, so if you take the height of the stack and divide it by the height of one book you should get the number of books in the stack".
S3: "If I take 46.5 and divide it by 3.1 it goes in exactly 15 times. I think the stack would have 15 books."
T: "Good thinking. When you were doing the height of a stack you found the rule h = 3.1n. [2] What rule in equation form would you use for undoing the height of a stack?"
S2: "We took the height of the stack divided by the thickness of one book to find the number of books. So our rule would be h/3.1 = n."
T: "So... what if we changed to a different book, how does it change the rule? Or... what if I started with a science book at the bottom and then stacked math books on top of the science book. How does it change the rule? Is it still proportional? Think about that tonight and we will start there tomorrow."
Resources
Teacher Notes
- Proportionality is a concept that appears very frequently across the 7th grade standards. It is important that teachers help students realize the importance of scalar thinking in proportionality and that it will appear in many places throughout the year.
- When looking at tables and graphs of proportional relationships, remind students to keep in mind the labels that match with the numbers (variables). Doing this will help them remember which way to divide to find the constant of proportionality (slope). For example: In a table of gallons of gasoline used and miles traveled it would be logical to divide miles by gallons because they are familiar with the phrase, miles-per-gallon.
- Students think that just because a relationship between variables increases or decreases by the same value, it is proportional. They need to know that that is not true. The graph of the relationship must pass through the origin as well as change by a constant amount. Thus, using an example like miles per gallon is a good way to illustrate this concept, because when gallons is 0 (the independent variable is zero) then the number of miles is also zero (0). Also, this is a good time to promote the habit of checking in a table to see if y/x (the slope of the values in the table) is always the same number, therefore the ratios are the same and the relationship is proportional.
- Using a graphical representation of equivalent fractions to develop student thinking about proportionality and a constant rate of change (slope) makes a good transition from rational numbers to proportionality. "Working with slopes can help students develop a deeper conceptual understanding of fractions that is not possible with other fraction models. Using slopes as fractions provides opportunities for students to practice working with fractions at the same time that they are working with the concept of slope. As a result, students are given the opportunity to learn the difficult concept of fractions creatively." ("FRACTIONS: A New Slant on Slope," Mathematics Teaching in the Middle School, Vol. 16, No. 1, August, 2010, p. 40.)
- Give students real life examples of direct proportional relationships and inverse proportional relationships and brainstorm similarities and differences. Some examples of direct proportional relationships might include: unit cost/total cost, time traveled (at a constant speed)/distance traveled, distance in feet/distance in meters, size of a gas tank/cost to fill up, or radius/circumference of a circle. Some examples of inverse proportional relationships might include: speed of a car/time spent traveling, number of workers/time needed to finish a task, length of a hammer/effort needed to pull a nail, or length of a rectangle/area of the rectangle.
- Allow students to become familiar with both general forms for a proportional relationship: y = kx and y/x = k. Help students see that both forms of the equation are equivalent and understand what "k" represents in a proportional relationship (constant of proportionality/slope).
Measuring Up Students learn to write and solve proportions by gathering data and calculating unit rates
Additional Instructional Resources
- Slope Slider An activity that allows students/teachers to move a slider to examine what happens to the graph of a linear function if the slope is changed or if the y-intercept is changed. Note: Remind students that the y-intercept needs to be zero in a proportional relationship's graph.
- Using the following examples: "Mona saves $5 per week." "The temperature is dropping 3 degrees every 2 hours." "To make punch, you add 3 parts juice to 4 parts water." Mona's savings proportional to the number of weeks she saves. The temperature is dropping proportionally to the time passing. The amount of water and juice are proportional to each other in the punch, and both are proportional to the amount of punch. Lanius, Cynthia and Williams, Susan E., "Proportionality: A Unifying Theme for the Middle Grades," Mathematics Teaching in the Middle School, Vol. 8, No. 3, April 2003, p. 393.
- Write a linear equation on the overhead. Give each row of the class different
x or y values to use in solving the equation. Let one row choose their own
values. When all have finished, have each row plot their points on a wall
coordinate grid. Discuss the reasons that all points fall on the same line. If
any points are not on the line, look for mistakes in calculations. Determine
the line's slope and y-intercept (Mississippi Mathematics Framework Revised Strategies, 2007, p. 46). - Top Ten Ideas about Proportional Relationships (article that students should take into High School Mathematics).
- Insights into Algebra Workshop 7 - Direct and Indirect Variation. http://www.learner.org/workshops/algebra/workshop7/lessonplan.html Includes 2 hands on lessons, videos, assessment questions, sample student work, teaching tips and more.
- Math Zombies In this lesson students translate among representations so that their understanding can advance from words to tables to graphs to equations. The concepts are covered in the context of playing a video game where Zombies are zapped to score points and advance a level in the game. Introduce to students the background about the video game. The main goal of the game is to earn points by zapping Zombies. Have a brief conversation about game levels and points earned. As students work through this lesson, keep them focused on the relationship between the different parts of the table.
- The Road to Proportional Reasoning. Scale City was produced as part of a national public television collaborative to create innovative online math resources for middle school students and teachers.
proportional relationship: Two quantities are said to have a proportional relationship if they vary in such a way that one of the quantities is a constant multiple of the other, or equivalently if they have a constant ratio.
proportion: An equation which states that two ratios are equal.
inversely proportional: y is inversely proportional to x if y = k/x.
directly proportional: If y = kx, then y is said to be directly proportional to x
linear: An equation in which the graphs of the solutions form a (non-vertical) line.
origin: The point of intersection of the vertical and horizontal axes of a Cartesian
plane. The coordinates of the origin are (0, 0).
proportional thinking: The ability to get or estimate an answer to a proportion without going through the equation-solving process.
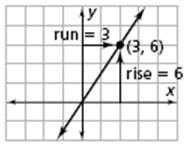
slope: The number that expresses the rate of change of a line. The slope is the ratio of the vertical change to the horizontal change between any two points on the line. Sometimes this ratio is referred to as the rise over the run. The slope of a horizontal line is 0. Slopes are positive if the y values increase from left to right on a coordinate grid and negative if the y values decrease from left to right. The slope of a vertical line is undefined. The slope of a line is the same as the constant rate of change between the two variables. For example, the points (0, 0) and (3, 6) lie on the graph of y = 2x. Between these points, the vertical change is 6 and the horizontal change is 3, so the slope is 6/3 = 2, which is the coefficient of x in the equation.
constant of proportionality: The constant value of the ratio of two proportional quantities x and y; usually written y = kx, where k is the constant of proportionality
Reflection - Critical Questions regarding the teaching and learning of these benchmarks
- Do students understand the difference between proportional and just linear?
- Are students able to pick out a proportional relationship from a verbal description?
- Are students able to pick out a proportional relationship from a table?
- Are students able to pick out a proportional relationship from a graph?
- How does the constant in a relationship help students solve the problems?
- Could students use the constant to write other ratios that would also have the same proportional relationship?
- How is finding a unit rate similar to proportionality?
- What does the constant tell you in this situation?
- Do the students see other non-math connections to proportions?
- If students are given a situation (written text, tabular, or graphical) they must analyze and determine if it is or is not proportional. What strategies should students use and what attributes should they look for to determine proportional or not proportional?
Materials
Lanius, C.S., & Williams, S. E. (April, 2003). Proportionality: A unifying theme for middle grades. Mathematics teaching in the middle school. Reston, VA: NCTM.
"FRACTIONS: A New Slant on Slope," Mathematics Teaching in the Middle School, Vol. 16, No. 1, August, 2010, p. 40.
Lanius, C.S., & Williams, S. E. (April, 2003). Proportionality: A unifying theme for middle grades. Mathematics teaching in the middle school. Reston, VA: NCTM.
Schielack, J. F. (2010). Focus in grade 7: Teaching with curriculum focal points. Reston, VA: National Council of Teachers of Mathematics.
Assessment
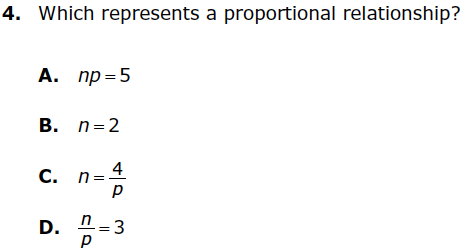
- Which represents a proportional relationship?
Correct Answer: Choice A
Minnesota MCA Series III Mathematics Item Sampler, Grade 7
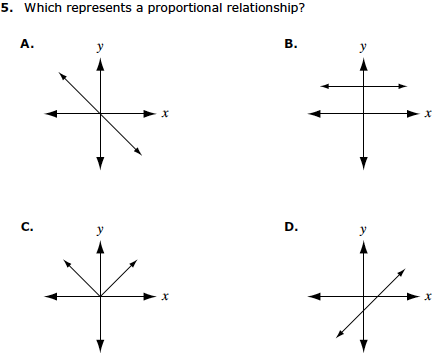
- Which represents a proportional relationship?
Correct Answer: Choice D
Minnesota MCA Series III Mathematics Item Sampler, Grade 7
- Samantha types an average of 50 words per minute. Which of the following graphs shows the relationship between the total number of words Samantha types and the time she spends typing?
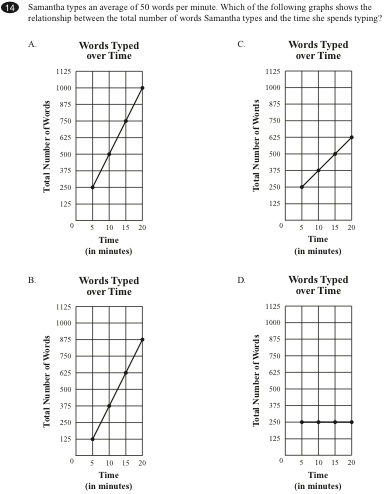
Correct Answer: Choice A
Massachusetts Comprehensive Assessment System Release of Spring 2009 Test Items
Exit slip:
- What does it mean if two quantities have a proportional relationship?(sample student response: "The constant of proportionality helps solve the problems because it is what you can multiply by to get any value, because it never changes." "as one quantity changes the other changes also, with each quantity consistently changing the same way")
- A certain rectangle has a length and width that are whole numbers of inches, and the ratio of its length to its width is 5 to 4. Its area is 500 square inches. What are its length and width?
Differentiation
- Allow use of calculators.
- Partner with a student more fluent in the graphing calculator.
- Provide a list of steps for entering equations into graphing calculator.
- Allow use of a math dictionary.
- Provide plenty of graph paper in various sizes.
- Ask questions such as, "What is the pattern?" "What do you think about what _________ said?" "What do we do now?"
- Have a step by step procedure for them to follow laid out on their desks.
Challenges of Students' Experience with Algebra
- Translate word problems into mathematical symbols (processing).
- Distinguish between patterns or detailed information (visual).
- Describe or paraphrase an explanation (auditory).
- Link the concrete to a representation to the abstract (visual).
- Remember vocabulary and processes (memory).
- Show fluency with basic number operations (memory).
- Maintain focus for a period of time (attention deficit).
- Show written work (reversal of numbers and letters)
- Use of a math dictionary
- Confusion of the two definitions of table; make sure they are clear on the mathematical definition of table before proceeding
- Provide graphing calculators or other technology for them to use
- Provide plenty of graph paper in various sizes
- Teachers should support ELLs who need extra time for dialogue by
- Provide opportunities to work in groups. When possible, pair each ELL with another student who has some fluency in the ELL's dominant language and who can function as a "peer tutor." http://www.tsusmell.org/downloads/Products/Classroom%20Resources/MELL_TeachersGuide.pdf
- Students will use the graph representation to see how the constant will affect the rate of change in a proportional relationship, and they will need to find the constant and write an equation in y = kx form to input in the graphing calculator
- Charles saw advertisements for two cellular telephone companies. Keep-in-Touch offers phone service for a basic fee of $20.00 a month plus $0.10 for each minute used. ChitChat has no monthly basic fee, but charges $0.45 a minute. Both companies use technology that allows them to charge for the exact amount of time used; they do not "round up" the time to the nearest minute, as many of their competitors do. Compare these two companies' charges for the time used each month. Students can see that one model, ChitChat is proportional, and one, Keep in Touch, is not. Lanius, C.S., & Williams, S.E. (April, 2003). Proportionality: A Unifying Theme for Middle Grades. Mathematics Teaching in the Middle School. NCTM.
- Coolmath Precalculus Review: Calculus Preview Lesson 1 - Graphing - Slopes of Lines. This Precalculus review lesson (Calculus preview) reviews slopes of lines, gives an introduction to the Calculus notation dy/dx and gets students ready for the difference quotient. .
- Math Stars Newsletter: The purpose of Math Stars is to challenge students beyond the classroom setting. Good problems can inspire curiosity about number relationships and geometric properties. It is hoped that in accepting the challenge of mathematical problem solving, students, their parents, and their teachers will be led to explore new mathematical horizons.
Parents/Admin
Administrative/Peer Classroom Observation
|
Students are ... |
Teachers are ... |
|
drawing pictures to represent a proportional relationship |
encouraging students to show multiple ways to determine understanding of proportionality |
|
solving problems involving proportional reasoning |
asking students to explain why they believe a given problem is proportional or not |
|
showing understanding in multiple forms: draw pictures, show mathematically, write a written response to express understanding of proportionality |
requiring students to represent proportional relationships in all forms (table, graph, equation, words) |
|
engaged in active participation in activities |
requiring students to translate to other forms of representation given a particular form (ex., given the graph of a proportional relationship, make the table, write the equation, and describe a situation that could possibly match the relationship) |
|
translating picture form to an algebraic expression in the form y=kx |
exposing students to proportional and non-proportional representations of linear functions |
|
constantly answering the question, "what does proportionality mean?" |
helping students realize there are two ways to write a proportional relationship: y = kx and y/x = k |
|
illustrating proportionality as linear functions in the form y=mx |
requiring students to calculate the constant of proportionality (slope) for a given relationship, represented in any form (words, table, graph, equation). |
|
illustrating proportionality geometrically as a line that passes through the origin |
|
|
illustrating proportionality in words, such as "Mike earns $250 every 2 weeks." |
|
|
seeing a connection between proportionality and multiplication |
|