3.4.1 Data Analysis
Collect, display and interpret data using frequency tables, bar graphs, picture graphs and number line plots having a variety of scales. Use appropriate titles, labels and units.
Overview
Standard 3.4.1 Essential Understandings
Third graders collect, display and interpret data. They expand their work with data displays to include frequency tables and number line plots having a variety of scales.
All Standard Benchmarks
3.4.1.1 Collect, display and interpret data using frequency tables, bar graphs, picture graphs and number line plots having a variety of scales. Use appropriate titles, labels and units.
What students should know and be able to do [at a mastery level] related to these benchmarks:
- formulate questions and collect data.
- organize and classify data from surveys and questionnaires using a tally chart or frequency table.
- understand the concept of scale and key in a data representation.
- display data using
- frequency tables,
- bar graphs,
- picture graphs (keys not exceeding 5),
- number line plots with scale increments not exceeding 5.
- understand that appropriate titles, labels, units, and keys are needed on data representations so the information can be interpreted correctly.
- describe parts of the data and the set of data as a whole to determine what the data show.
- use the information on a graph to answer questions.
Work from previous grades that supports this new learning includes:
- pose questions and gather data about themselves and their surroundings.
- represent data using concrete objects, pictures, and graphs.
- describe parts of the data and the set of data as a whole to determine what the data show.
- understand that titles and labels are needed on data representations so the information can be interpreted correctly.
- use the information on a graph to answer questions.
NCTM Standards
Formulate questions that can be addressed with data and collect, organize, and display relevant data to answer them.
Grades 3-5 Expectations:
- design investigations to address a question and consider how data collection methods affect the nature of the data set;
- collect data using observations, surveys and experiments;
- represent data using tables and graphs such as line plots, bar graphs, and line graphs;
- recognize the difference in representing categorical and numerical data.
Common Core State Standards
Represent and interpret data.
- 3.MD.3. Draw a scaled picture graph and a scaled bar graph to represent a data set with several categories. Solve one- and two-step "how many more" and "how many less" problems using information presented in scaled bar graphs. For example, draw a bar graph in which each square in the bar graph might represent 5 pets.
- 3.MD.4. Generate measurement data by measuring lengths using rulers marked with halves and fourths of an inch. Show the data by making a line plot, where the horizontal scale is marked off in appropriate units- whole numbers, halves, or quarters.
Misconceptions
Students may think...
- the scale is automatically one and overlook the scale or key in a data display.
- one category of data "won" or is the most without referring to the meaning of the data. Students may focus on the physical characteristics of the data representation rather than what the bars on the graph represent when analyzing data.
- all data displays are equally effective in representing any given data set.
- they can randomly choose a data representation for a set of data.
Resources
Teacher Notes
- Students may need support in further development of previously studied concepts and skills.
- Students need to understand the intervals of the scale on a data display need to be the same.
- Students may not understand the purpose and qualities of bar graphs, number line plots, pictographs, frequency tables and charts. They need help in choosing the most appropriate data display for a set of data.
- The data analysis process includes the following:
- Formulate a question (teacher guided)
With teacher direction, children formulate questions in conjunction with lessons on counting, measurement, numbers, and patterns.
- Make a plan for data collection
- Collect data
Organize data and select a data representation. (Pie charts and circle graphs are not appropriate for third graders.)
- Represent data:
- Charts include a title, categories and category labels and data.
- Tally mark charts include a title, categories, category labels and data
- Picture graphs (also called pictographs) should be seen both vertically and horizontally. They include a title, key, categories, category labels and data.
- Bar graphs include a title, scale, scale label, categories, category labels and data. They should be drawn both vertically and horizontally.
- Frequency tables include a title, categories, category labels and data counts, and should be drawn both vertically and horizontally.
- Number Line Plots use a segment of the number line. Unlike bar graphs, number line plots display values having no data points. They include a title, scale, scale label and data.
- Analyze Data
- When posing questions about collected and represented data refer to the initial question and use language that keeps the focus on the meaning of the data.
- For example: What do you know when looking at the graph, chart or table? Guide student responses so that they are related to the original question not the height of the bars on the graph. Students will look for patterns and draw conclusions based on the data.
- Which category shows the greatest, least number or any given number of responses to the original question? What does this tell us?
- Students will focus on the physical characteristic of the data representation and need the language to describe what this means when answering the original question.
- Note: A question such as, "Which column has the most?" does not connect the data representation to the meaning of the collected data. Asking questions that require students to compare two or more categories (with reference to the original question) involves a higher level of thinking.
- Reflect on the original question. Does the data we collected answer the original question? What else do you wonder about?
- Good questions, and good listening, will help children make sense of the mathematics, build self-confidence and encourage mathematical thinking and communication. A good question opens up a problem and supports different ways of thinking about it. The best questions are those that cannot be answered with a "yes" or a "no."
Getting Started
What do you need to find out?
What do you know now? How can you get the information? Where can you begin?
What terms do you understand/not understand?
What similar problems have you solved that would help?
While Working
How can you organize the information?
Can you make a drawing (model) to explain your thinking? What are other possibilities?
What would happen if...?
Can you describe an approach (strategy) you can use to solve this?
What do you need to do next?
Do you see any patterns or relationships that will help you solve this?
How does this relate to...?
Why did you...?
What assumptions are you making?
Reflecting about the Solution
How do you know your solution (conclusion) is reasonable? How did you arrive at your answer?
How can you convince me your answer makes sense?
What did you try that did not work? Has the question been answered?
Can the explanation be made clearer?
Responding (helps clarify and extend their thinking)
Tell me more.
Can you explain it in a different way?
Is there another possibility or strategy that would work?
Is there a more efficient strategy?
Help me understand this part ...
(Adapted from They're Counting on Us, California Mathematics Council, 1995)
- Graph data sets in bar graphs. The color, thickness and scale of the graph are adjustable. You can input your own data, or you can use or alter pre-made data sets.
In the first lesson of this unit, students formulate and refine questions that can be addressed with categorical data. They consider aspects of data collection such as how to word questions and how to record the data they collect. Finally they represent and analyze the data in order to answer the question posed.
In the second lesson of this unit, students pose and refine questions that can be addressed with numerical data. They consider aspects of data collection such as how to obtain measurements and record the data they collect. They represent and analyze the ordered numerical data by describing the shape and important features of a set of data and compare related data sets, with an emphasis on how the data are distributed. In collecting data, students measure with standard units and carry out simple unit conversions, such as from centimeters to meters or feet to inches.
In the final lesson of this unit, students recognize differences in representing and analyzing categorical and numerical data. Students also identify examples of each type of data.
Additional Instructional Resources
Bereska, C., Bolster, C., Bolster, L., & Scheaffer, R. (1998). Exploring statistics in the elementary grades: Book 1, grades K-6. Parsippany, NJ: Dale Seymour Publications.
Chapin, S., Koziol, A., MacPherson, J., & Rezba, C. (2007). Navigating through data analysis and probability in grades 3-5. Reston, VA: National Council of Teachers of Mathematics.
Van deWalle, J. and Lovin, L.H.(2006). Teaching student-centered mathematics grades k-3. Boston, MA: Pearson Education.
Van de Walle, J. & Lovin, L. (2006). Teaching student-centered mathematics grades 3-5. Boston, MA: Pearson Education.
Van de Walle, J., Karp, K., Bay-Williams, J. (2010). Elementary and middle school mathematics: Teaching developmentally. (7th ed.). Boston, MA: Allyn & Bacon.
New Vocabulary
"Vocabulary literally is the key tool for thinking."
Ruby Payne
number line plot - a way to organize data on a number line segment using Xs to depict each data point.
Mathematics vocabulary words describe mathematical relationships and concepts and cannot be understood by simply practicing definitions. Students need to have experiences communicating ideas using these words to explain, support, and justify their thinking.
Learning vocabulary in the mathematics classroom is contingent upon the following:
Integration: Connecting new vocabulary to prior knowledge and previously learned vocabulary. The brain seeks connections and ways to make meaning which occurs when accessing prior knowledge.
Repetition: Using the word or concept many times during the learning process and connecting the word or concept with its meaning. The role of the teacher is to provide experiences that will guarantee connections are made between mathematical concepts, relationships, and corresponding vocabulary words.
Meaningful Multiple and varied opportunities to use the words in context. These
Use: opportunities occur when students explain their thinking, ask clarifying questions, write about mathematics, and think aloud when solving problems. Teachers should be constantly probing student thinking in order to determine if students are connecting mathematics concepts and relationships with appropriate mathematics vocabulary.
Strategies for vocabulary development
Students do not learn vocabulary words by memorizing and practicing definitions. The following strategies keep vocabulary visible and accessible during instruction.
Mathematics Word Bank: Each unit of study should have word banks visible during instruction. Words and corresponding definitions are added to the word bank as the need arises. Students refer to word banks when communicating mathematical ideas which leads to greater understanding and application of words in context.
Labeled pictures and charts: Diagrams that are labeled provide opportunities for students to anchor their thinking as they develop conceptual understanding and increase opportunities for student learning.
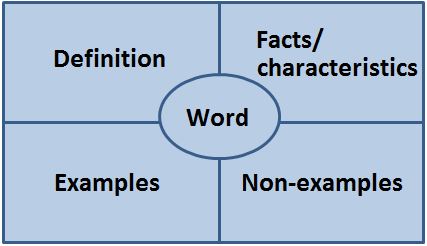
Frayer Model: The Frayer Model connects words, definitions, examples and non-examples.

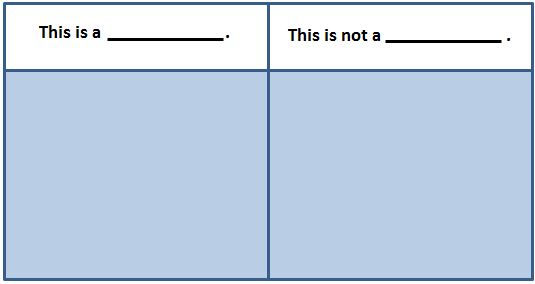
Example/Non-example Charts: This graphic organizer allows students to reason about mathematical relationships as they develop conceptual understanding of mathematics vocabulary words. Teachers should use these during the instructional process to engage student in thinking about the meaning of words.
Vocabulary Strips: Vocabulary strips give students a way to organize critical information about mathematics vocabulary words.
|
word |
definition |
illustration |
Encouraging students to verbalize thinking by drawing, talking, and writing increases opportunities to use the mathematics vocabulary words in context.
Additional Resources for Vocabulary Development
Murray, M. (2004). Teaching mathematics vocabulary in context. Portsmouth, NH: Heinemann.
Sammons, L. (2011). Building mathematical comprehension: Using literacy strategies to make meaning. Huntington Beach, CA: Shell Education.
Reflection - Critical Questions regarding the teaching and learning of these benchmarks
What are the key ideas related to data analysis at the third grade level? How do student misconceptions interfere with mastery of these ideas?
What experiences do students need in order to develop an understanding of data analysis at the third grade level?
What data displays should third graders be able to use?
What type of data is best represented by a frequency table? A number line plot?
What should third graders know about number line plots? What common errors might third graders make when constructing number line plots?
What kind of questions might students be asked to answer when interpreting a data display?
When checking for student understanding, what should teachers
- listen for in student conversations?
- look for in student work?
- ask during classroom discussions?
Examine student work related to a task involving data analysis using a number line plot. What evidence do you need to say a student is proficient? Using three pieces of student work, determine what student understanding is observed through the work.
How can teachers assess student learning related to these benchmarks?
How are these benchmarks related to other benchmarks at the third grade level?
Professional Learning Community Resources
Bamberger, H., Oberdorf, C., & Schultz-Ferrell, K. (2010). Math misconceptions prek-grade 5: From misunderstanding to deep understanding. Portsmouth, NH: Heinemann.
Chapin, S., and Johnson, A. (2006). Math matters: Understanding the math you teach, grades K-8. (2nd ed.). Sausalito, CA: Math Solutions Press.
Chapin, S., O'Connor, C., & Canavan Anderson, N. (2009). Classroom discussions: Using math talk to help students learn (Grades K-6). Sausalito, CA: Math Solutions.
Fosnot, C., & Dolk, M. (2002). Young mathematicians at work: Multiplication and division. Portsmouth, NH: Heinemann.
Hyde, Arthur. (2006). Comprehending math adapting reading strategies to teach mathematics, K-6. Portsmouth, NH: Heinemann.
Lester, F. (2010). Teaching and learning mathematics: Transforming research for elementary school teachers. Reston, VA: National Council of Teachers of Mathematics.
Otto, A., Caldwell, J., Wallus Hancock, S., & Zbiek, R.(2011). Developing essential understanding of multiplication and division for teaching mathematics in grades 3 - 5. Reston, VA.: National Council of Teachers of Mathematics.
Parrish, S. (2010). Number talks: Helping children build mental math and computation strategies grades K-5. Sausalito. CA: Math Solutions.
Sammons, L., (2011). Building mathematical comprehension: Using literacy strategies to make meaning. Huntington Beach, CA: Shell Education.
Schielack, J. (2009). Focus in grade 3, teaching with curriculum focal points. Reston, VA: National Council of Teachers of Mathematics.
Bamberger, H., Oberdorf, C., & Schultz-Ferrell, K. (2010). Math misconceptions prek-grade 5: From misunderstanding to deep understanding. Portsmouth, NH: Heinemann.
Bender, W. (2009). Differentiating math instruction: Strategies that work for k-8 classrooms! Thousand Oaks, CA: Corwin Press.
Bresser, R., Melanese, K., & Sphar, C. (2008). Supporting English language learners in math class, grades k-2. Sausalito, CA: Math Solutions Publications.
Burns, Marilyn. (2007). About teaching mathematics: A k-8 resource (3rd ed.). Sausalito, CA: Math Solutions Publications.
Burns, M. (Ed). (1998). Leading the way: Principals and superintendents look at math instruction. Sausalito, CA: Math Solutions.
Caldera, C. (2005). Houghton Mifflin math and English language learners. Boston, MA: Houghton Mifflin Company.
Carpenter, T., Fennema, E., Franke, M., Levi, L., & Empson, S. (1999). Children's mathematics cognitively guided instruction. Portsmouth, NH: Heinemann.
Cavanagh, M. (2006). Math to learn: A mathematics handbook. Wilmington, MA: Great Source Education Group, Inc.
Chapin, S., & Johnson, A. (2006). Math matters: Understanding the math you teach, grades K-8. (2nd ed.). Sausalito, CA: Math Solutions Press.
Chapin, S., O'Connor, C., & Canavan Anderson, N. (2009). Classroom discussions: Using math talk to help students learn (Grades K-6). Sausalito, CA: Math Solutions.
Dacey, L., & Salemi, R. (2007). Math for all: Differentiating instruction k-2. Sausalito, CA: Math Solutions.
Donovan, S., & Bradford, J. (Eds). (2005). How students learn: Mathematics in the classroom. Washington, DC: National Academies Press.
Dougherty, B., Flores, A., Louis, E., & Sophian, C. (2010). Developing essential understanding of number & numeration pre-k-grade 2. Reston, VA: National Council of Teachers of Mathematics.
Felux, C., & Snowdy, P. (Eds.). ( 2006). The math coach field guide: Charting your course. Sausalito, CA: Math Solutions.
Fuson, K., Clements, D., & Beckmann, S. (2009). Focus in grade 2 teaching with curriculum focal points. Reston, VA: National Council of Teachers of Mathematics.
Hyde, Arthur. (2006). Comprehending math adapting reading strategies to teach mathematics, K-6. Portsmouth, NH: Heinemann.
Kilpatrick, J., & Swafford, J. (Eds). (2001). Adding it up: Helping children learn mathematics. Washington, DC: National Academies Press.
Leinwand, S. (2000). Sensible mathematics: A guide for school leaders. Portsmouth, NH: Heinemann.
Lester, F. (2010). Teaching and learning mathematics: Transforming research for elementary school teachers. Reston, VA: National Council of Teachers of Mathematics.
Murray, M. (2004). Teaching mathematics vocabulary in context. Portsmouth, NH: Heinemann.
Murray, M., & Jorgensen, J. (2007). The differentiated math classroom: A guide for teachers k-8. Portsmouth, NH: Heinemann.
National Council of Teachers of Mathematics. (2000). Principles and standards for school mathematics. Reston, VA: NCTM.
Parrish, S. (2010). Number talks: Helping children build mental math and computation strategies grades K-5. Sausalito. CA: Math Solutions.
Reeves, D. (2007). Ahead of the curve: The power of assessment to transform teaching and learning. Indiana: Solution Tree Press.
Sammons, L. (2011). Building mathematical comprehension: Using literacy strategies to make meaning. Huntington Beach, CA: Shell Education.
Schielack, J., Charles, R., Clements, D., Duckett, P., Fennell, F., Lewandowski, S., ... & Zbiek, R. M. (2006). Curriculum focal points for prekindergarten through grade 8 mathematics: A quest for coherence. Reston, VA: NCTM.
Seeley, C. (2009). Faster isn't smarter: Messages about math teaching and learning in the 21st century. Sausalito, CA: Math Solutions.
Small, M. (2009). Good questions: Great ways to differentiate mathematics instruction. New York, NY: Teachers College Press.
Van de Walle, J., Karp, K., Bay-Williams, J. (2010). Elementary and middle school mathematics: Teaching developmentally. (7th ed.). Boston, MA: Allyn & Bacon.
Van de Walle, J. A., & Lovin, L. H. (2006). Teaching student-centered mathematics grades K-3. Boston, MA: Pearson Education.
West, L., & Staub, F. (2003). Content focused coaching: Transforming mathematics lessons. Portsmouth, NH: Heinemann.
Assessment
- The graph below shows how many children in Mrs. Nelson's class are 8, 9, and 10 years old.
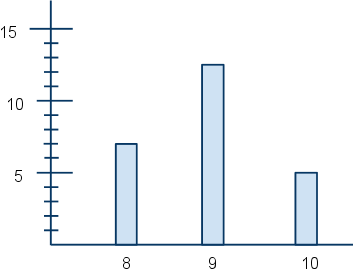
Ages of students
Which of the following is true?
A. Most of the students are younger than 9.
B. Most of the students are younger than 10.
C. Most of the students are 9 years old or older.
D. None of the above is true.
Solution: C. Most of the students are 9 years old or older
Benchmark: 3.4.1.1
- Using the same graph (above), tell how many more students are 9 years old than are 8.
A. 9
B. 3
C. 13
D. 6
Solution: D. 6
Benchmark: 3.4.1.1
- The line plot below shows how students scored on last week's math test. The scores below show how many they got right out of 20 possible.
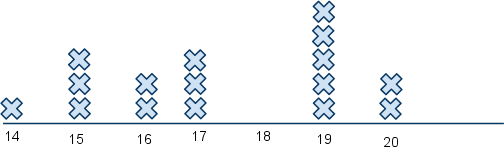
How many students got 18 or more right on the test?
A. 7
B. 2
C. 5
D. 4
Solution: A. 7
Benchmark: 3.4.1.1
What is the difference between the highest score and the lowest score possible?
A. 1
B. 5
C. 6
D. 3
Solution: C. 6
Benchmark: 3.4.1.1
How many students scored less than 17 points on the test?
A. 7
B. 5
C. 4
D. 6
Solution: D. 6
Benchmark: 3.4.1.1
How many students got 19 correct on their test?
A. 7
B. 4
C. 5
D. 3
Solution: C. 5
Benchmark: 3.4.1.1
Differentiation
- Students need to use multiple representations of the same data as they develop an understanding of data analysis.
- Emergent learners may have difficulty with the fact that number line plots include values that have no data points.
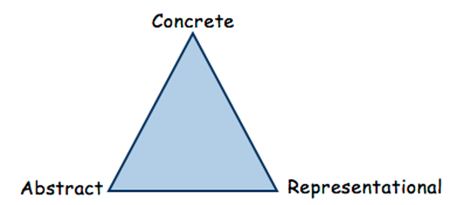
Concrete - Representational - Abstract Instructional Approach
The Concrete-Representational-Abstract Instructional Approach (CRA) is a research-based instructional strategy that has proven effective in enhancing the mathematics performance of students who struggle with mathematics.
The CRA approach is based on three stages during the learning process:
Concrete - Representational - Abstract
The Concrete Stage is the doing stage. The concrete stage is the most critical in terms of developing conceptual understanding of mathematical skills and concepts. At this stage, teachers use manipulatives to model mathematical concepts. The physical act of touching and moving manipulatives enables students to experience the mathematical concept at a concrete level. Research shows that students who use concrete materials develop more precise and comprehensive mental representations, understand and apply mathematical concepts, and are more motivated and on-task. Manipulatives must be selected based upon connections to the mathematical concept and the students' developmental level.
The Representational Stage is the drawing stage. Mathematical concepts are represented using pictures or drawings of the manipulatives previously used at the Concrete Stage. Students move to this level after they have successfully used concrete materials to demonstrate conceptual understanding and solve problems. They are moving from a concrete level of understanding toward an abstract level of understanding when drawing or using pictures to represent their thinking. Students continue exploring the mathematical concept at this level while teachers are asking questions to elicit student thinking and understanding.
The Abstract Stage is the symbolic stage. Teachers model mathematical concepts using numbers and mathematical symbols. Operation symbols are used to represent addition, subtraction, multiplication and division. Some students may not make a clean transfer to this level. They will work with some symbols and some pictures as they build abstract understanding. Moving to the abstract level too quickly causes many student errors. Practice at the abstract level will not lead to increased understanding unless students have a foundation based upon concrete and pictorial representations.
Additional Resources
Bender, W. (2009). Differentiating math instruction: Strategies that work for k-8 classrooms! Thousand Oaks, CA. Corwin Press.
Dacey, L., & Lynch, J. (2007). Math for all: Differentiating instruction grades 3-5. Sausalito, CA: Math Solutions.
Murray, M. & Jorgensen, J. (2007). The differentiated math classroom: A guide for teachers k-8. Portsmouth, NH: Heinemann.
Small, M. (2009). Good questions: Great ways to differentiate mathematics instruction. New York, NY: Teachers College Press.
Van de Walle, J., Karp, K., Bay-Williams, J. (2010). Elementary and middle school mathematics: Teaching developmentally. (7th ed.). Boston, MA: Allyn & Bacon.
Van de Walle, J., & Lovin, L. (2006) Teaching student-centered mathematics grades K-3. Boston: Pearson Education.
Van de Walle, J., & Lovin, L. (2006). Teaching student-centered mathematics grades 3-5. Boston, MA: Pearson Education.
- Students need to use multiple representations of the same data as they develop an understanding of data analysis.
- Word banks need to be part of the student learning environment in every mathematics unit of study. Refer to these throughout instruction.
- Word Use vocabulary graphic organizers such as the Frayer model (see below) to emphasize vocabulary words count, first, second, third, etc.
- Sentence Frames
Math sentence frames provide support that English Language Learners need in order to fully participate in math discussions. Sentence frames provide appropriate sentence structure models, increase the likelihood of responses using content vocabulary, help students to conceptualize words and build confidence in English Language Learners.
Sample sentence frames related to these benchmarks:
|
A number line plot shows ___________________________________. |
- When assessing the math skills of an ELL student it is important to determine if the student has difficulty with the math concept or with the language used to describe the concept and conceptual understanding.
Additional ELL Resources
Bresser, R., Melanese, K., & Sphar, C. (2008). Supporting English language learners in math class, grades k-2. Sausalito, CA: Math Solutions Publications.
For a given data set decide on the most effective data display and justify their thinking.
Display a given data set in several ways. For each data display write questions that could be answered using that display.
Additional Resources
Bender, W. (2009). Differentiating math instruction: Strategies that work for k-8 classrooms! Thousand Oaks, CA: Corwin Press.
Dacey, L., & Lynch, J. (2007). Math for all: Differentiating instruction grades 3-5. Sausalito, CA: Math Solutions.
Murray, M. & Jorgensen, J. (2007). The differentiated math classroom: A guide for teachers k-8. Portsmouth, NH: Heinemann.
Small, M. (2009). Good questions: Great ways to differentiate mathematics instruction. New York, NY: Teachers College Press.
Parents/Admin
Administrative/Peer Classroom Observation
|
Students are... |
Teachers are... |
|
collecting, organizing and representing data in charts, pictographs, bar graphs, frequency tables and number line plots.
|
creating real-world experiences for collecting data.
|
|
using appropriate titles, labels, keys and scales in data displays.
|
providing experiences that demonstrate the need for appropriate labels, keys and scales in data displays. |
|
analyzing data with their classmates and communicating information in data displays.
|
asking open-ended questions like: How do you know? Will that always be the case? What are the similarities and differences between . . .? What questions could you ask that could be answered with this data?
|
What should I look for in the mathematics classroom?
(Adapted from SciMathMN,1997)
What are students doing?
- Working in groups to make conjectures and solve problems.
- Solving real-world problems, not just practicing a collection of isolated skills.
- Representing mathematical ideas using concrete materials, pictures and symbols. Students know how and when to use tools such as blocks, scales, calculators, and computers.
- Communicating mathematical ideas to one another through examples, demonstrations, models, drawing, and logical arguments.
- Recognizing and connecting mathematical ideas.
- Justifying their thinking and explaining different ways to solve a problem.
What are teachers doing?
- Making student thinking the cornerstone of the learning process. This involves helping students organize, record, represent, and communicate their thinking.
- Challenging students to think deeply about problems and encouraging a variety of approaches to a solution.
- Connecting new mathematical concepts to previously learned ideas.
- Providing a safe classroom environment where ideas are freely shared, discussed and analyzed.
- Selecting appropriate activities and materials to support the learning of every student.
- Working with other teachers to make connections between disciplines to show how math is related to other subjects.
- Using assessments to uncover student thinking in order to guide instruction and assess understanding.
Additional Resources
For Mathematics Coaches
Chapin, S. and Johnson, A. (2006). Math matters: Understanding the math you teach: Grades k-8, 2nd edition. Sausalito, CA: Math Solutions.
Donovan, S., & Bradford, J. (Eds). (2005). How students learn: Mathematics in the classroom. Washington, DC: National Academies Press.
Felux, C., & Snowdy, P. (Eds.). ( 2006). The math coach field guide: Charting your course. Sausalito, CA: Math Solutions.
Sammons, L., (2011). Building mathematical comprehension: Using literacy strategies to make meaning. Huntington Beach, CA: Shell Education.
West, L., & Staub, F. (2003). Content focused coaching: Transforming mathematics lessons. Portsmouth, NH: Heinemann.
For Administrators
Burns, M. (Ed). (1998). Leading the way: Principals and superintendents look at math instruction. Sausalito, CA: Math Solutions.
Kilpatrick, J., & Swafford, J. (Eds). (2001). Adding it up: Helping children learn mathematics. Washington, DC: National Academies Press.
Leinwand, S. (2000). Sensible mathematics: A guide for school leaders. Portsmouth, NH: Heinemann.
Lester, F. (2010). Teaching and learning mathematics: Transforming research for school administrators. Reston, VA: National Council of Teachers of Mathematics.
Seeley, C. (2009). Faster isn't smarter: Messages about math teaching and learning in the 21st century. Sausalito, CA: Math Solutions.
Parent Resources
Mathematics handbooks to be used as home references:
Cavanagh, M. (2004). Math to Know: A mathematics handbook. Wilmington, MA: Great Source Education Group, Inc.
Cavanagh, M. (2006). Math to learn: A mathematics handbook. Wilmington, MA: Great Source Education Group, Inc.
Helping your child learn mathematics
Provides activities for children in preschool through grade 5
What should I look for in the mathematics program in my child's school? A Guide for Parents developed by SciMathMN
Help Your Children Make Sense of Math
Ask the right questions
In helping children learn, one goal is to assist children in becoming critical and independent thinkers. You can help by asking questions that guide, without telling them what to do.
Good questions, and good listening, will help children make sense of the mathematics, build self-confidence and encourage mathematical thinking and communication. A good question opens up a problem and supports different ways of thinking about it. The best questions are those that cannot be answered with a "yes" or a "no."
Getting Started
What do you need to find out?
What do you know now? How can you get the information? Where can you begin?
What terms do you understand/not understand?
What similar problems have you solved that would help?
While Working
How can you organize the information?
Can you make a drawing (model) to explain your thinking? What are other possibilities?
What would happen if . . . ?
Can you describe an approach (strategy) you can use to solve this?
What do you need to do next?
Do you see any patterns or relationships that will help you solve this?
How does this relate to ...?
Can you make a prediction?
Why did you...?
What assumptions are you making?
Reflecting about the Solution
How do you know your solution (conclusion) is reasonable? How did you arrive at your answer?
How can you convince me your answer makes sense?
What did you try that did not work?
Has the question been answered?
Can the explanation be made clearer?
Responding (helps clarify and extend their thinking)
Tell me more.
Can you explain it in a different way?
Is there another possibility or strategy that would work?
Is there a more efficient strategy?
Help me understand this part...
Adapted from They're counting on us, California Mathematics Council, 1995.