2.1.2C Number & Data
Use addition and subtraction to create and obtain information from tables, bar graphs and tally charts.
Overview
Essential Understandings
Second graders use their understanding of addition and subtraction to develop quick recall of basic facts with sums to 18 and the related subtraction facts. Quick recall of basic facts include the use of these mental strategies:
- counting on and counting back
- composing and decomposing numbers (12 is the same as 8 and 4 or 7 and 5, etc)
- making a ten (9 + 5 = 10 + 4)
- fact families (7 + 6 = 13, 6 + 7 =13, 13 - 7 = 6, 13 - 6 = 7)
- doubles and doubles plus/minus one
- commutative property (6 + 9 = 9 + 6)
- associative property (5 + 8 = (3 + 2) + 8 = 3 + (2 + 8) = 3 + 10 = 13)
Second graders develop, understand, explain and use accurate and generalizable methods to add and subtract two-digit whole numbers. Estimating sums and differences is also included in the work with addition and subtraction. They use mental strategies and algorithms based on place value and equality to solve problems. Strategies include
- composing and decomposing numbers, expanded notation, partial sums and differences (47 - 23 = (40 - 20) + (7 - 3) = 20 + 4 = 24)
- associative property
All Standard Benchmarks
2.1.2.1 Use strategies to generate addition and subtraction facts including making tens, fact families, doubles plus or minus one, counting on, counting back, and the commutative and associative properties. Use the relationship between addition and subtraction to generate basic facts.
2.1.2.2 Demonstrate fluency with basic addition facts and related subtraction facts.
2.1.2.3 Estimate sums and differences up to 100.
2.1.2.4 Use mental strategies and algorithms based on knowledge of place value to add and subtract two-digit numbers. Strategies may include decomposition, expanded notation, and partial sums and differences.
2.1.2.5 Solve real-world and mathematical addition and subtraction problems involving whole numbers with up to 2 digits.
2.1.2.6 Use addition and subtraction to create and obtain information from tables, bar graphs and tally charts.
**************************************************************
Benchmark Group C
2.1.2.6 Use addition and subtraction to create and obtain information from tables, bar graphs and tally charts.
What students should know and be able to do [at a mastery level] related to these benchmarks:
- pose questions and gather data about themselves and their surroundings.
- represent data using concrete objects, pictures, and graphs.
- describe parts of the data and the set of data as a whole to determine what the data show.
- understand that titles and labels are needed on data representations so the information can be interpreted correctly.
- use the information on a graph to answer questions.
Work from previous grades that supports this new learning includes:
- Use addition, subtraction and comparison skills to create and analyze bar graphs and tally charts.
- add and subtract.
- represent data using tables, charts and bar graphs.
- sort objects according to attributes.
NCTM Standards
Understand meanings of operations and how they relate to one another
Pre-K - 2 Expectations
- understand various meanings of addition and subtraction of whole numbers and the relationship between the two operations;
- understand the effects of adding and subtracting whole numbers;
- understand situations that entail multiplication and division, such as equal groupings of objects and sharing equally.
Compute fluently and make reasonable estimates.
Pre-K-2 Expectations:
- develop and use strategies for whole-number computations, with a focus on addition and subtraction;
- develop fluency with basic number combinations for addition and subtraction;
- use a variety of methods and tools to compute, including objects, mental computation, estimation, paper and pencil, and calculators.
Formulate questions that can be addressed with data and collect, organize, and display relevant data to answer them.
Pre-K-2 Expectations
- pose questions and gather data about themselves and their surroundings;
- sort and classify objects according to their attributes and organize data about the objects;
- represent data using concrete objects, pictures, and graphs.
- describe parts of the data and the set of data as a whole to determine what the data show.
Select and use appropriate statistical methods to analyze data.
Pre-K - 2 Expectations
- describe parts of the data and the set of data as a whole to determine what the data show.
Common Core State Standards
Represent and solve problems involving addition and subtraction.
2.OA.1. Use addition and subtraction within 100 to solve one- and two-step word problems involving situations of adding to, taking from, putting together, taking apart, and comparing, with unknowns in all positions, e.g., by using drawings and equations with a symbol for the unknown number to represent the problem.1
Add and subtract within 20.
2.OA.2. Fluently add and subtract within 20 using mental strategies. By end of Grade 2, know from memory all sums of two one-digit numbers.
Work with equal groups of objects to gain foundations for multiplication.
2.OA.3. Determine whether a group of objects (up to 20) has an odd or even number of members, e.g., by pairing objects or counting them by 2s; write an equation to express an even number as a sum of two equal addends.
2.OA.4. Use addition to find the total number of objects arranged in rectangular arrays with up to 5 rows and up to 5 columns; write an equation to express the total as a sum of equal addends.
Use place value understanding and properties of operations to add and subtract.
2.NBT.5. Fluently add and subtract within 100 using strategies based on place value, properties of operations, and/or the relationship between addition and subtraction.
2.NBT.6. Add up to four two-digit numbers using strategies based on place value and properties of operations.
2.NBT.7. Add and subtract within 1000, using concrete models or drawings and strategies based on place value, properties of operations, and/or the relationship between addition and subtraction; relate the strategy to a written method. Understand that in adding or subtracting three-digit numbers, one adds or subtracts hundreds and hundreds, tens and tens, ones and ones; and sometimes it is necessary to compose or decompose tens or hundreds.
2.NBT.8. Mentally add 10 or 100 to a given number 100-900, and mentally subtract 10 or 100 from a given number 100-900.
2.NBT.9. Explain why addition and subtraction strategies work, using place value and the properties of operations.
Represent and interpret data.
2.MD.9. Generate measurement data by measuring lengths of several objects to the nearest whole unit, or by making repeated measurements of the same object. Show the measurements by making a line plot, where the horizontal scale is marked off in whole-number units.
1.MD.10. Draw a picture graph and a bar graph (with single-unit scale) to represent a data set with up to four categories. Solve simple put-together, take-apart, and compare problems1 using information presented in a bar graph.
Misconceptions
Students may think...
- the scale is automatically one and overlook the scale in a bar graph.
- that one category of data "won" or is the most without referring to the meaning of the data; students may focus on the physical characteristics of the data representation rather than what the bars on the graph represent when analyzing data.
Vignette
This classroom vignette takes place in a second grade classroom in the spring. The children have worked with data organization at various times throughout the year.
Ms. G. - Let's do another data collection activity. Who can tell me what "data" means?
Serena - It's like information you get from people.
Ms. G. - Tell me more . . .
Serena - Well, you can ask them questions and keep track of their answers.
Ms. G. - What kind of data have we collected this year?
Evan - We asked people how they got to school - car, walking, or bus.
Cian - I remember that! We did that one a long time ago.
Bardilio - We did our favorite foods.
Armando - Pocket day!
Ms. G. - What are some of the ways we have organized the data we collected?
Serena - We made some tally charts.
Grace - Bar graphs.
Ms. G. - Let's list some ideas about data we can collect today.
Rotho - We could do our favorite class.
Ms. G. - Wouldn't everyone choose math as their favorite?
Giggles all around. . . .
Kim - Let's graph the colors in a big bag of Skittles!
Ms. G. - That would be fun, but I don't have any Skittles!
Cam - Let's do the Summer Fun Food Drive.
Ms. G. - Tell me more . . .
Cam - We can keep track of the food we collect next week for the food drive.
Ms. G. - What, exactly, should we track?
Cam - How many things we bring in every day.
Ms. G. - Okay. We'll collect data about the number of items we bring in every day. Then on Friday, we can compile and analyze our data.
Serena - What does 'compile' mean?
Ms. G. - Any thoughts?
Cian - I bet it has something to do with making a graph.
Ms. G. - Good thinking, Cian. 'Compile' means to collect and display our data.
Evan - I already know what 'analyze' means - it means to talk about it and see if we can find any patterns, or something.
Ms. G. - Nice explanation, Evan. Okay, how shall we keep track of the information we collect next week?
Serena - Let's just write down how many things we bring in every day.
Ms. G. - That will work. Let's make a class goal for the food drive. If there are 28 kids in our class, how many items do we want to try to bring in next week?
Cam - I think everyone could bring in one thing a day. That would just be five cans or boxes or bags.
Ms. G. - Does that sound like a reasonable goal?
The class agrees with the goal.
Ms. G. - So, if everyone brings in five cans each, how many cans would we expect to collect over the week?
Carlos - Well, if there were only 20 kids in our class, that would be 100 cans.
Ms. G. - How do you know?
Carlos - Because twenty plus twenty is forty, and forty plus twenty is sixty, and sixty plus twenty is eighty, and twenty more is one hundred.
Ms. G. - Right - five 20s is 100, but we have 28 kids in our class.
Carlos - So we just have to add on eight more fives, which would be forty.
Ms. G. - So, what is our goal?
Carlos - One hundred forty cans.
Ms. G. - We're set, then. Our goal is for each person to bring in five items sometime next week.
The following week, food items were brought in, counted and recorded on the board daily.
On Friday, the lesson continued.
Ms. G. - How do you want to organize our data?
Cam - Let's make a bar graph.
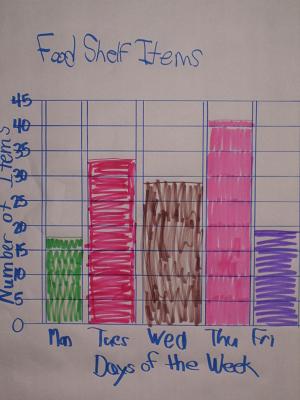
Ms. G. - Okay. What title will we use?
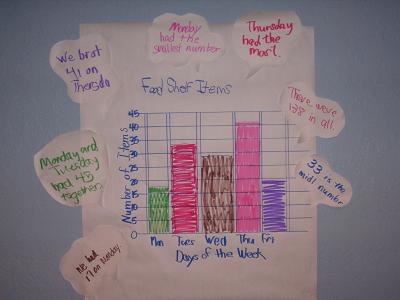
Cam - Food Shelf Items
Ms. G. - That's pretty clear. We've got the title. Cam, please write that on the board.
What should we write here on the left?
Serena - That could be the number of things.
Ms. G. - Go ahead and write it up there, Serena.
Serena - I changed it to 'items' to match Cam.
Ms. G. - That works. What will go on the horizontal axis?
Armando - Days of the week?
Ms. G. - Good idea. What numbers should be put on the vertical axis?
Rotho - Some of our numbers are pretty big - maybe we should count by fives.
Ms. G. - Sounds good! Let's start at zero and work our way up, counting by fives. How far up should we go?
Rotho - How about up to 45, because 41 is our biggest number?
Ms. G. - Sure, let's do that.
Rotho writes the numbers on the vertical axis.
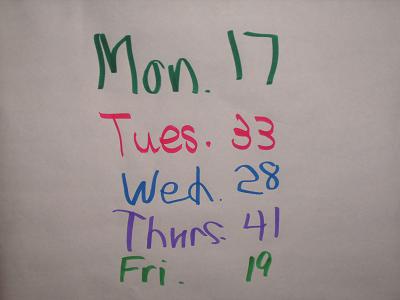
Ms. G. - Let's fill in the bar graph. How many items did we bring in on Monday?
Evan - 17.
Ms. G. - There is no 17 on our graph, so what are we going to do?
Gracie - We have 15 and we have 20. 17 would be about in the middle.
Ms. G. - Nice reasoning. Please draw the bar where you think 17 would be.
How many items for Tuesday?
Cian - 33.
Ms. G. - Will that bar be taller or shorter than Monday's bar?
Cian - Taller.
Ms. G. - Why?
Cian - Because 33 is more than 17.
Ms. G. - How much more?
Cian - Let me see, uh . . .10 more would be 27, so 30 would be 13 more, and 33 would be 16 more. Hey - that's almost a double!
Ms. G. - Wow - you're right! How about Wednesday?
Jason - 28 - it's like everyone brought in one thing that day.
Ms. G. - Could be. Jason, would you please draw the bar for 28?
Abdi - We brought in 41 items on Thursday. That was the most all week!
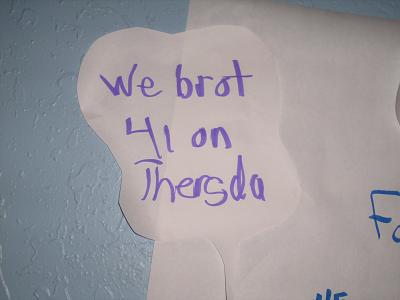
Ms. G. - So what do you know about Thursday's bar?
Abdi - It's going to be the highest because it's the most!
Ms. G. - That's right. Draw it on the board, please. We have one day left. How about Friday?
Serena - 19.
Ms. G. - Okay, draw the bar. Now let's look at the data. What does the highest bar mean?
Anthony - That's the day we brought in the most cans.
Ms. G. - Which day was it?
Diana - Thursday.
Ms. G. - Which day has the fewest items?
Cam - Monday - there were only 17.
Ms. G. - What is the difference between the highest number of items and the lowest number of items?
David - It would be 41 minus 17 which is. . . 23.
Ms. G. - How do you know?
David - Well, it has to be smaller than 30, because that would make 47, but bigger than 20, because that's only 37. So, I know 7 plus 3 makes another 10, so 23. - Wait - it's 24, because it's 41, not 40.
Ms. G. - Nice reasoning. What else does our tally chart tell us?
Armando - We brought in 138 things altogether.
Ms. G. - How can you tell that from the bar graph?
Armando - I added up all the numbers.
Ms. G. - How did you do that?
Armando - I counted the tens - 10, 40, 60, 100, 110. Then I made tens with the ones - seven plus three is a ten and nine plus one is a ten and then there's the eight. That's another twenty eight which makes 138. But, really, I used the numbers on the board, because it's hard to tell exactly what the bars mean on our graph because we only counted by fives.
Ms. G. - Good explanation! What other questions could we ask about the information on our graph?
Kim - Did we bring in more things in the first part of the week or the last part?
Ms. G. - How would we figure that out?
Kim - Wednesday is the middle. So, we could look at Monday and Tuesday and compare it with Thursday and Friday.
Ms. G. - What do you notice when you do that?
Kim - I know we brought in more for the end of the week.
Ms. G. - You figured that out pretty quickly - how did you do that?
Kim - I ignored Wednesday, and the numbers on Monday and Tuesday are both smaller than the numbers on Thursday and Friday, so Thursday and Friday win!
Ms. G. - Did we need an exact number to answer Kim's question?
Serena - No, because she didn't ask 'How many?' She just asked about which was more.
Ms. G. - Good point. What would we do if we wanted to know how many more items we brought in the last part of the week compared to the first part of the week?
Gracie - We would have to add the numbers for Monday and Tuesday. Then add the numbers for Thursday and Friday. Then we have to compare those numbers.
Ms. G. - Okay, everyone please follow Gracie's suggestion. Figure out the difference between the number of items we brought in during the first part of the week and the last part of the week. Then compare those numbers.
Ms. G. monitors the class as they work in their math notebooks.
Ms. G. - What did you figure out?
Cian - We brought in 50 things on Monday and Tuesday.
Ms. G. - How about the end of the week?
Gracie - On Thursday and Friday we brought in 60 things altogether.
Ms. G. - So, how many more items did we bring in at the end of the week compared to the beginning of the week?
Gracie - Ten - because fifty plus ten more is sixty.
Ms. G. - Nice job, Gracie.
Ms. G. - Good job. Okay, I would like everyone to write one thought bubble using the information from our graph. Then, over the weekend, see if you can find any examples of bar graphs in the newspaper. If you can, bring them in on Monday and we'll look at them to see what we can find out!
Resources
- Students may need support in further development of previously studied concepts and skills.
- This benchmark is in the Number and Operations strand because students use addition and subtraction up to two digits to understand and analyze data from real-world situations. Data analysis is the context for further developing an understanding of number and operations.
- Since students are to use addition and subtraction up to two digits, data collection will go beyond an individual classroom.
- The data analysis process includes the following:
- Formulate a question (teacher guided). With teacher direction, children formulate questions in conjunction with lessons on counting, measurement, numbers, and patterns.
- Make a plan for data collection
- Collect data
- Organize data and select a data representation. Data representations include (pie charts and circle graphs are not appropriate for second grade):
- Charts: include a title, categories and category labels and data.
- Tally marks: include a title, categories, category labels and data
- Bar graphs: should be drawn both vertically and horizontally. Bar graphs include a title, scale, scale label, categories, category labels and data.
- Represent data using an appropriate representation.
- Analyze data by posing questions about collected and represented data; refer to the initial question and use language that keeps the focus on the meaning of the data categories. For example:
- What do you know when looking at the graph, chart or table? Guide student responses so that they are related to the original question, not the height of the bars on the graph. Students will look for patterns and draw conclusions based on the data.
- Which category shows the greatest or least number, or any given number of responses to the original question? What does this tell us? Students will focus on the physical characteristic of the data representation and need the language to describe what this means when answering the original question. Note: a question such as, "Which column has the most?" does not connect the data representation to the meaning of the collected data.
- Asking questions that require students to compare two or more categories (with reference to the original question) involves a higher level of thinking.
- Reflect on the original question. Does the data we collected answer the original question? What else do you wonder about?
- Good questions, and good listening, will help children make sense of the mathematics, build self-confidence and encourage mathematical thinking and communication. A good question opens up a problem and supports different ways of thinking about it. The best questions are those that cannot be answered with a "yes" or a "no."
Getting Started
What do you need to find out?
What do you know now? How can you get the information? Where can you begin?
What terms do you understand/not understand?
What similar problems have you solved that would help?
While Working
How can you organize the information?
Can you make a drawing (model) to explain your thinking? What are other possibilities?
What would happen if...?
Can you describe an approach (strategy) you can use to solve this?
What do you need to do next?
Do you see any patterns or relationships that will help you solve this?
How does this relate to...?
Why did you...?
What assumptions are you making?
Reflecting about the Solution
How do you know your solution (conclusion) is reasonable? How did you arrive at your answer?
How can you convince me your answer makes sense?
What did you try that did not work? Has the question been answered?
Can the explanation be made clearer?
Responding (helps clarify and extend their thinking)
Tell me more.
Can you explain it in a different way?
Is there another possibility or strategy that would work?
Is there a more efficient strategy?
Help me understand this part ...
(Adapted from They're Counting on Us, California Mathematics Council, 1995)
NCTM Illuminations
- Look at Me - In this unit, students collect data and display it with tally marks, pictographs, bar graphs, and glyphs.
- Amazing Attributes - In this unit, students collect data using objects, pictures, and symbols. They organize data by sorting and classifying in different ways. Students display data using multiple representations.
- Eye to Eye - In this lesson, students learn to pose mathematical questions about themselves and their surroundings. They gather data about eye color from their classmates and another class within their school. They organize this data to answer questions.
Additional Instructional Resources
Bereska, C., Bolster, C., Bolster, L., & Scheaffer, R. (1998). Exploring statistics in the elementary grades: Book 1, grades K-6. Parsippany, NJ: Dale Seymour Publications.
Sheffield, L., Cavanagh, M., Dacey, L., Findell, C., Greenes, C., & Small, M. (2001). Navigating through data analysis and probability in prekindergarten-grade 2. Reston, VA: National Council of Teachers of Mathematics.
Small, M. (2009). Good questions: Great ways to differentiate mathematics instruction. New York, NY: Teachers College Press.
Van de Walle, J., Karp, K., & Bay-Williams, J. (2010). Elementary and middle school mathematics: Teaching developmentally. (7th ed.). Boston, MA: Allyn & Bacon.
Van de Walle, J., & Lovin, L. (2006). Teaching student-centered mathematics grades k-3. Boston, MA: Pearson Education.
scale
"Vocabulary literally is the key tool for thinking."
Ruby Payne
Mathematics vocabulary words describe mathematical relationships and concepts and cannot be understood by simply practicing definitions. Students need to have experiences communicating ideas using these words to explain, support, and justify their thinking.
Learning vocabulary in the mathematics classroom is contingent upon the following:
Integration: Connecting new vocabulary to prior knowledge and previously learned vocabulary. The brain seeks connections and ways to make meaning which occurs when accessing prior knowledge.
Repetition: Using the word or concept many times during the learning process and connecting the word or concept with its meaning. The role of the teacher is to provide experiences that will guarantee connections are made between mathematical concepts, relationships, and corresponding vocabulary words.
Meaningful Multiple and varied opportunities to use the words in context. These
Use: opportunities occur when students explain their thinking, ask clarifying questions, write about mathematics, and think aloud when solving problems. Teachers should be constantly probing student thinking in order to determine if students are connecting mathematics concepts and relationships with appropriate mathematics vocabulary.
Strategies for vocabulary development
Students do not learn vocabulary words by memorizing and practicing definitions. The following strategies keep vocabulary visible and accessible during instruction.
Mathematics Word Bank: Each unit of study should have word banks visible during instruction. Words and corresponding definitions are added to the word bank as the need arises. Students refer to word banks when communicating mathematical ideas which leads to greater understanding and application of words in context.
Labeled pictures and charts: Diagrams that are labeled provide opportunities for students to anchor their thinking as they develop conceptual understanding and increase opportunities for student learning.
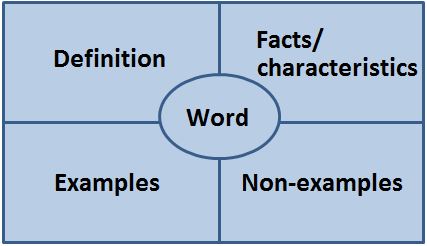
Frayer Model: The Frayer Model connects words, definitions, examples and non-examples.

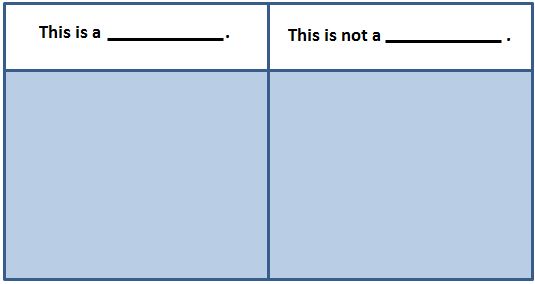
Example/Non-example Charts: This graphic organizer allows students to reason about mathematical relationships as they develop conceptual understanding of mathematics vocabulary words. Teachers should use these during the instructional process to engage student in thinking about the meaning of words.
Vocabulary Strips: Vocabulary strips give students a way to organize critical information about mathematics vocabulary words.
|
word |
definition |
illustration |
Encouraging students to verbalize thinking by drawing, talking, and writing increases opportunities to use the mathematics vocabulary words in context.
Additional Resources for Vocabulary Development
Murray, M. (2004). Teaching mathematics vocabulary in context. Portsmouth, NH: Heinemann.
Sammons, L. (2011). Building mathematical comprehension: Using literacy strategies to make meaning. Huntington Beach, CA: Shell Education.
Reflection - Critical Questions regarding the teaching and learning of these benchmarks
What are the key ideas related to data analysis at the second grade level? How do student misconceptions interfere with mastery of these ideas?
What experiences do students need in order to develop an understanding of data analysis?
What data displays will second graders use to represent a data set?
What kind of problems might students solve when using a data display?
When checking for student understanding, what should teachers
- listen for in student conversations?
- look for in student work?
- ask during classroom discussions?
Examine student work related to a task involving data analysis. What evidence do you need to say a student is proficient? Using three pieces of student work, determine what student understanding is observed through the work.
How can teachers assess student learning related to these benchmarks?
How are these benchmarks related to other benchmarks at the second grade level?
Professional Learning Community Resources
Bamberger, H., Oberdorf, C., & Schultz-Ferrell, K.. (2010). Math misconceptions prek-grade 5: from misunderstanding to deep understanding. Portsmouth, NH: Heinemann.
Chapin, S. and Johnson, A. (2006). Math Matters, Understanding the Math You Teach, Grades K-8, 2nd Edition. Sausalito, CA: Math Solutions Press.
Chapin, S., O'Connor, C., & Canavan Anderson, N. (2009). Classroom discussions: using math talk to help students learn (Grades K-6). Sausalito, CA: Math Solutions.
Hyde, Arthur. (2006) Comprehending math adapting reading strategies to teach mathematics, K-6. Portsmouth, NH: Heinemann.
Lester, F. (2010). Teaching and learning mathematics: transforming research for elementary school teachers. Reston, VA: National Council of Teachers of Mathematics.
Sammons, L., (2011). Building Mathematical Comprehension-Using Literacy Strategies to Make Meaning. Huntington Beach, CA: Shell Education.
Additional Resources
Bender, W. (2009). Differentiating math instruction-Strategies that work for k-8 classrooms! Thousand Oaks, CA: Corwin Press.
Dacey, L., & Lynch, J. (2007). Math for all: Differentiating instruction grades k-2. Sausalito, CA: Math Solutions.
Murray, M. & Jorgensen, J. (2007). The differentiated math classroom-A guide for teachers k-8. Portsmouth, NH: Heinemann.
Small, M. (2009). Good questions: Great ways to differentiate mathematics instruction. New York, NY: Teachers College Press.
Additional Resources
Bender, W. (2009). Differentiating math instruction-Strategies that work for k-8 classrooms! Thousand Oaks, CA: Corwin Press.
Dacey, L., & Lynch, J. (2007). Math for all: Differentiating instruction grades k-2. Sausalito, CA: Math Solutions.
Murray, M., & Jorgensen, J. (2007). The differentiated math classroom-A guide for teachers k-8. Portsmouth, NH: Heinemann.
Small, M. (2009). Good questions: Great ways to differentiate mathematics instruction. New York, NY: Teachers College Press.
Van de Walle, J., Karp, K., & Bay-Williams, J. (2010). Elementary and middle school mathematics: Teaching developmentally. (7th ed.). Boston, MA: Allyn & Bacon.
Van de Walle, J., & Lovin, L. (2006). Teaching student-centered mathematics grades k-3. Boston, MA: Pearson Education.
Additional Resources
For Mathematics Coaches
Chapin, S. and Johnson, A. (2006). Math matters: Understanding the math you teach: Grades k-8. (2nd ed.). Sausalito, CA: Math Solutions.
Donovan, S., & Bradford, J. (Eds). (2005). How students learn: Mathematics in the classroom. Washington, DC: National Academies Press.
Felux, C., & Snowdy, P. (Eds.). ( 2006). The math coach field guide: Charting your course. Sausalito, CA: Math Solutions.
Sammons, L., (2011). Building mathematical comprehension: Using literacy strategies to make meaning. Huntington Beach, CA: Shell Education.
West, L., & Staub, F. (2003). Content focused coaching: Transforming mathematics lessons. Portsmouth, NH: Heinemann.
For Administrators
Burns, M. (Ed). (1998). Leading the way: Principals and superintendents look at math instruction. Sausalito, CA: Math Solutions.
Kilpatrick, J., & Swafford, J. (Eds). (2001). Adding it up: Helping children learn mathematics. Washington, DC: National Academies Press.
Leinwand, S. (2000). Sensible mathematics: A guide for school leaders. Portsmouth, NH: Heinemann.
Lester, F. (2010). Teaching and learning mathematics: Transforming research for school administrators. Reston, VA: National Council of Teachers of Mathematics.
Seeley, C. (2009). Faster isn't smarter: Messages about math teaching and learning in the 21st century. Sausalito, CA: Math Solutions.
References
Bamberger, H., Oberdorf, C., & Schultz-Ferrell, K. (2010). Math misconceptions prek-grade 5: From misunderstanding to deep understanding. Portsmouth, NH: Heinemann.
Bender, W. (2009). Differentiating math instruction-Strategies that work for k-8 classrooms! Thousand Oaks, CA.: Corwin Press.
Bresser, R., Melanese, K., & Sphar, C. (2008). SupportingEenglish language learners in math class, grades k-2. Sausalito, CA: Math Solutions Publications.
Burns, Marilyn. (2007). About teaching mathematics: A k-8 resource (3rd ed.). Sausalito, CA: Math Solutions Publications.
Burns, M. (Ed). (1998). Leading the way: Principals and superintendents look at math instruction. Sausalito, CA: Math Solutions.
Caldera, C. (2005). Houghton Mifflin math and English language learners. Boston, MA: Houghton Mifflin Company.
Carpenter, T., Fennema, E., Franke, M., Levi, L., & Empson, S. (1999). Children's mathematics cognitively guided instruction. Portsmouth, NH: Heinemann.
Cavanagh, M. (2006). Math to learn: A mathematics handbook. Wilmington, MA: Great Source Education Group, Inc.
Chapin, S., & Johnson, A. (2006). Math matters, Understanding the math you teach, Grades K-8. (2nd ed.). Sausalito, CA: Math Solutions Press.
Chapin, S., O'Connor, C., & Canavan Anderson, N. (2009). Classroom discussions: Using math talk to help students learn (Grades K-6). Sausalito, CA: Math Solutions.
Dacey, L., & Salemi, R. (2007). Math for all: Differentiating instruction k-2. Sausalito, CA: Math Solutions.
Donovan, S., & Bradford, J. (Eds). (2005). How students learn: Mathematics in the classroom. Washington, DC: National Academies Press.
Dougherty, B., Flores, A., Louis, E., & Sophian, C. (2010). Developing essential understanding of number & numeration pre-k-grade 2. Reston, VA: National Council of Teachers of Mathematics
Felux, C., & Snowdy, P. (Eds.). ( 2006). The math coach field guide: charting your course. Sausalito, CA: Math Solutions.
Fuson, K., Clements, D., & Beckmann, S. (2009). Focus in grade 2 teaching with curriculum focal points. Reston, VA: National Council of Teachers of Mathematics.
Hyde, Arthur. (2006) Comprehending math adapting reading strategies to teach mathematics, K-6. Portsmouth, NH: Heinemann.
Kilpatrick, J., & Swafford, J. (Eds). (2001). Adding it up: Helping children learn mathematics. Washington, DC: National Academies Press.
Leinwand, S. (2000). Sensible mathematics: A guide for school leaders. Portsmouth, NH: Heinemann.
Lester, F. (2010). Teaching and learning mathematics: Transforming research for elementary school teachers. Reston, VA: National Council of Teachers of Mathematics.
Murray, M. (2004). Teaching mathematics vocabulary in context. Portsmouth, NH: Heinemann.
Murray, M., & Jorgensen, J. (2007). The differentiated math classroom-A guide for teachers k-8. Portsmouth, NH: Heinemann.
National Council of Teachers of Mathematics. (2000). Principles and standards for school mathematics. Reston, VA: NCTM.
Parrish, S. (2010). Number talks: Helping children build mental math and computation strategies grades K-5. Sausalito. CA: Math Solutions.
Sammons, L., (2011). Building mathematical comprehension-Using literacy strategies to make meaning. Huntington Beach, CA: Shell Education.
Schielack, J., Charles, R., Clements, D., Duckett, P., Fennell, F., Lewandowski, S., ... & Zbiek, R. M. (2006). Curriculum focal points for prekindergarten through grade 8 mathematics: A quest for coherence. Reston, VA: NCTM.
Seeley, C. (2009). Faster isn't smarter-Messages about math teaching and learning in the 21st century. Sausalito, CA: Math Solutions.
Small, M. (2009). Good questions: Great ways to differentiate mathematics instruction. New York, NY: Teachers College Press.
Van de Walle, J., Karp, K., Bay-Williams, J. (2010). Elementary and middle school mathematics: Teaching developmentally. (7th ed.). Boston, MA: Allyn & Bacon.
Van de Walle, J. A., & Lovin, L. H. (2006). Teaching student-centered mathematics grades K-3. Boston, MA: Pearson Education.
West, L., & Staub, F. (2003). Content focused coaching: Transforming mathematics lessons. Portsmouth, NH: Heinemann.
Assessment
2.1.2 C Data and Number
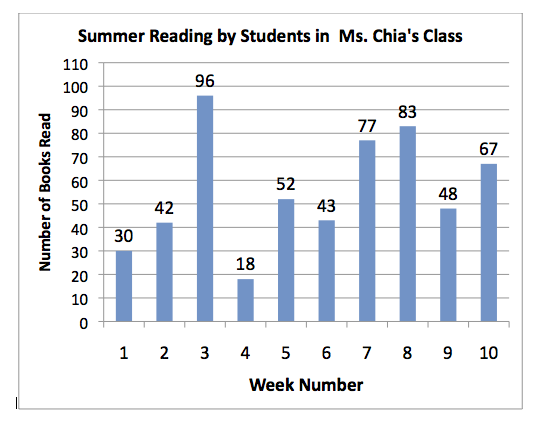
1. How many books were read in Week 4?
2. How many total books were read in Weeks 5 and 6?
3. How many total books were read in Weeks 2 and 3?
4. How many more books were read in Week 3 than Week 10?
5. How many fewer books were read in Week 9 than Week 8?
6. In what weeks were more than 55 books read?
7. Find two weeks whose sum is greater than 130.
8. Find two weeks whose difference is less than 15.
Solution: 1. 18 books
2. 95 books
3. 138 books
4. 29 books
5. 35 books
6. Weeks 3, 7, 8, and 10
7. Answers will vary. For example, Weeks 2 and 3, Weeks 3 and 5, Weeks 7 and 10, etc.
8. Answers will vary. For example, Weeks 7 and 8, Weeks 1 and 2, Weeks 5 and 6, etc.
Benchmark: 2.1.2.6
Differentiation
- Emergent learners may benefit from more experiences on the concrete level by using actual items to construct a bar graph or tally chart.
- As students transfer data from a tally chart to a bar graph, they may make errors in the data. Helping students develop a system to account for all data is important.
- When answering questions about a graph, students may confuse how many more and how many in all. Demonstrate the difference in wording using physical objects in connection with the data display.
Concrete - Representational - Abstract Instructional Approach
The Concrete-Representational-Abstract Instructional Approach (CRA) is a research-based instructional strategy that has proven effective in enhancing the mathematics performance of students who struggle with mathematics.
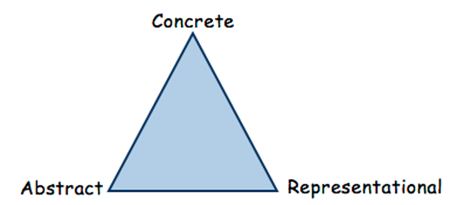
The CRA approach is based on three stages during the learning process:
Concrete - Representational - Abstract
The Concrete Stage is the doing stage. The concrete stage is the most critical in terms of developing conceptual understanding of mathematical skills and concepts. At this stage, teachers use manipulatives to model mathematical concepts. The physical act of touching and moving manipulatives enables students to experience the mathematical concept at a concrete level. Research shows that students who use concrete materials develop more precise and comprehensive mental representations, understand and apply mathematical concepts, and are more motivated and on-task. Manipulatives must be selected based upon connections to the mathematical concept and the students' developmental level.
The Representational Stage is the drawing stage. Mathematical concepts are represented using pictures or drawings of the manipulatives previously used at the Concrete Stage. Students move to this level after they have successfully used concrete materials to demonstrate conceptual understanding and solve problems. They are moving from a concrete level of understanding toward an abstract level of understanding when drawing or using pictures to represent their thinking. Students continue exploring the mathematical concept at this level while teachers are asking questions to elicit student thinking and understanding.
The Abstract Stage is the symbolic stage. Teachers model mathematical concepts using numbers and mathematical symbols. Operation symbols are used to represent addition, subtraction, multiplication and division. Some students may not make a clean transfer to this level. They will work with some symbols and some pictures as they build abstract understanding. Moving to the abstract level too quickly causes many student errors. Practice at the abstract level will not lead to increased understanding unless students have a foundation based upon concrete and pictorial representations.
- Word banks need to be part of the student learning environment in every mathematics unit of study.
- Use vocabulary graphic organizers such as the Frayer model (see below) to emphasize vocabulary words count, first, second, third, etc.
- Sentence Frames
Math sentence frames provide support that English Language Learners need in order to fully participate in math discussions. Sentence frames provide appropriate sentence structure models, increase the likelihood of responses using content vocabulary, help students to conceptualize words and build confidence in English Language Learners.
Sample sentence frames related to these benchmarks:
|
This graph is about ____________________________________________________. |
|
When looking at the graph, I know ________________ because _________________. |
- When assessing the math skills of an ELL student it is important to determine if the student has difficulty with the math concept or with the language used to describe the concept and conceptual understanding.
Additional ELL Resources
Bresser, R., Melanese, K., & Sphar, C. (2008). Supporting English language learners in math class, grades k-2. Sausalito, CA: Math Solutions Publications.
- Graph Collage
Students look for different examples of charts and bar graphs in newspapers, magazines, advertisements, and websites. What do the charts and graphs show? How do graphs help people understand data? Allow students to share their findings and draw comparisons.
Children can write questions based on the information given in a graph. By writing questions, children reinforce their understanding of what a graph shows.
Parents/Admin
Administrative/Peer Classroom Observation
|
Students are . . . |
Teachers are . . . |
|
collecting data from classmates and recording the data in charts and bar graphs. |
creating real-world experiences for collecting data, such as letters in their names, favorite movies, or favorite ice cream flavors. |
|
analyzing data in tables, bar graphs, and tally charts to answer questions. |
reinforcing in class discussions these vocabulary words: tally chart, table, and bar graph. |
|
transferring data from a chart to a simple bar graph. |
extending learning by asking questions such as, "Is there another way we could represent these same data?" |
|
drawing conclusions when studying tables, tally charts, and bar graphs. |
supporting learners by differentiating for a variety of levels of success. Using concrete materials for those struggling to visualize graphs or extensions for those ready, such as writing questions about a graph. |
|
discussing the data with their classmates.
|
asking open-ended questions like: How do you know? Will that always be the case? What are the similarities and differences between . . .? What questions could you ask that could be answered with these data? |
What should I look for in the mathematics classroom? (Adapted from SciMathMN,1997)
What are students doing?
- Working in groups to make conjectures and solve problems.
- Solving real-world problems, not just practicing a collection of isolated skills.
- Representing mathematical ideas using concrete materials, pictures and symbols. Students know how and when to use tools such as blocks, scales, calculators, and computers.
- Communicating mathematical ideas to one another through examples, demonstrations, models, drawing, and logical arguments.
- Recognizing and connecting mathematical ideas.
- Justifying their thinking and explaining different ways to solve a problem.
What are teachers doing?
- Making student thinking the cornerstone of the learning process. This involves helping students organize, record, represent, and communicate their thinking.
- Challenging students to think deeply about problems and encouraging a variety of approaches to a solution.
- Connecting new mathematical concepts to previously learned ideas.
- Providing a safe classroom environment where ideas are freely shared, discussed and analyzed.
- Selecting appropriate activities and materials to support the learning of every student.
- Working with other teachers to make connections between disciplines to show how math is related to other subjects.
- Using assessments to uncover student thinking in order to guide instruction and assess understanding.
For Mathematics Coaches:
Chapin, S. and Johnson, A. (2006). Math matters, understanding the math you teach, grades k-8, 2nd edition. Sausalito, CA: Math Solutions.
Donovan, S., & Bradford, J. (Eds). (2005). How students Learn: Mathematics in the Classroom. Washington, DC.: National Academies Press.
Felux, C., & Snowdy, P. (Eds.). ( 2006). The math coach field guide: charting your course. Sausalito, CA: Math Solutions.
Sammons, L., (2011). Building Mathematical Comprehension-Using Literacy Strategies to Make Meaning. Huntington Beach, CA: Shell Education.
West, L., & Staub, F. (2003). Content focused coaching: transforming mathematics lessons.
Portsmouth, NH: Heinemann.
For Administrators:
Burns, M. (Edt).(1998). Leading the way: principals and superintendents look at math instruction. Sausalito, CA: Math Solutions.
Kilpatrick, J., & Swafford, J. (Eds). (2001). Adding it up: helping children learn mathematics. Washington, DC.: National Academies Press.
Leinwand, S., (2000). Sensible mathematics: a guide for school leaders. Portsmouth, NH: Heinemann.
Lester, F. (2010). Teaching and learning mathematics: transforming research for school administrators. Reston, VA: National Council of Teachers of Mathematics.
Seeley, C. (2009). Faster isn’t smarter-messages about math teaching and learning in the 21st century. Sausalito, CA: Math Solutions.
Mathematics handbooks to be used as home references:
Cavanagh, M. (2004). Math to Know: A mathematics handbook. Wilmington, MA: Great Source Education Group, Inc.
Cavanagh, M. (2006). Math to learn: A mathematics handbook. Wilmington, MA: Great Source Education Group, Inc.
Helping your child learn mathematics
Provides activities for children in preschool through grade 5
What should I look for in the mathematics program in my child's school? A Guide for Parents developed by SciMathMN
Help Your Children Make Sense of Math
Ask the right questions
In helping children learn, one goal is to assist children in becoming critical and independent thinkers. You can help by asking questions that guide, without telling them what to do.
Good questions, and good listening, will help children make sense of the mathematics, build self-confidence and encourage mathematical thinking and communication. A good question opens up a problem and supports different ways of thinking about it. The best questions are those that cannot be answered with a "yes" or a "no."
Getting Started
What do you need to find out?
What do you know now? How can you get the information? Where can you begin?
What terms do you understand/not understand?
What similar problems have you solved that would help?
While Working
How can you organize the information?
Can you make a drawing (model) to explain your thinking? What are other possibilities?
What would happen if . . . ?
Can you describe an approach (strategy) you can use to solve this?
What do you need to do next?
Do you see any patterns or relationships that will help you solve this?
How does this relate to ...?
Can you make a prediction?
Why did you...?
What assumptions are you making?
Reflecting about the Solution
How do you know your solution (conclusion) is reasonable? How did you arrive at your answer?
How can you convince me your answer makes sense?
What did you try that did not work?
Has the question been answered?
Can the explanation be made clearer?
Responding (helps clarify and extend their thinking)
Tell me more.
Can you explain it in a different way?
Is there another possibility or strategy that would work?
Is there a more efficient strategy?
Help me understand this part...
Adapted from They're counting on us, California Mathematics Council, 1995
Your child can also create a question and choices to survey their family and friends. Then have them create a tally chart and bar graph. Ideas for surveys may be favorite snacks, food, restaurants, games, or toys.
Visit the BrainPOP Jr. website and scroll down to "Tally Charts and Bar Graphs Family Activities." There are ideas for a family graph and a community population study with data from the U.S. Census Bureau website.
There is also a video to explain tally charts and bar graphs and a number of activities to try. See this page.
This link takes you to a fun bar graphing game