Modeling Word Problems
Overview
Using models is a critical step in helping students transition from concrete manipulative work with word problems to the abstract step of generating an equation to solve contextual problems. By learning to use simple models to represent key mathematical relationships in a word problem, students can more easily make sense of word problems, recognize both the number relationships in a given problem and connections among types of problems, and successfully solve problems with the assurance that their solutions are reasonable.
Importance
Why is modeling word problems important?
Mr. Alexander and teachers from his grade level team were talking during their Professional Learning Community (PLC) meeting about how students struggle with word problems. Everyone felt only a few of their students seem to be able to quickly generate the correct equation to solve the problem. Many students just seem to look for some numbers and do something with them, hoping they solve the problem.
Mr. Alexander had recently learned about using modeling for word problems in a workshop he had attended. He began to share the model diagrams with his teammates and they were excited to see how students might respond to this approach. They even practiced several model diagrams among themselves as no one had ever learned to use models with word problems. Since part of their PLC work freed them up to observe lessons in each others' rooms, they decided they would watch Mr. Alexander introduce modeling to his students.
So, two days later they gathered in Mr. Alexander's room for the math lesson. Mr. Alexander presented the following problem:
Lily and her brother, Scotty, were collecting cans for the recycling drive. One weekend they collected 59 cans and the next weekend they collected 85 cans. How many cans were collected in all?
Mr. Alexander went over the problem and drew a rectangular bar divided into two parts on the board, explaining that each part of the rectangle was for the cans collected on one of the weekends and the bracket indicated how many cans were collected in all. Reviewing the problem, Mr. Alexander asked students what was not known, and where the given numbers would go and why. This resulted in the following bar model:
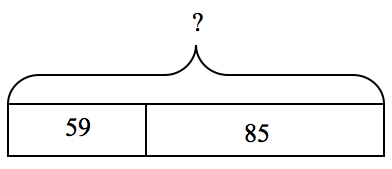
The class then discussed what equations made sense given the relationship of the numbers in the bar model. This time many students wrote the equation, 59 + 85 = ?, and solved the problem. In their discussion after the lesson, Mr. Alexander's teammates mentioned that they noticed a much higher degree of interest and confidence in problem solving when Mr. Alexander introduced the bar model. Everyone noticed that many more students were successful in solving problems once modeling was introduced and encouraged. As the class continued to do more word problems, the diagrams appeared to be a helpful step in scaffolding success with word problems.
Word problems require that students have the skills to read, understand, strategize, compute, and check their work. That's a lot of skills! Following a consistent step-by-step approach-and providing explicit, guided instruction in the beginning - can help our students organize their thoughts and make the problem-solving task manageable. Forsten, 2010, p.1 | Students often have regarded each word problem as a new experience, and fail to connect a given problem to past problems of a similar type. Students need to sort out the important information in a word problem, and identify the relationships among the numbers involved in the situation. A model can help students organize their thinking about a given problem, and identify an equation that would be helpful in solving the problem. Models are a kind of graphic organizer for the numbers in a word problem, and may connect to students' work with graphic organizers in other subjects. |
The failure to capture the mathematics being taught with a picture that helps students visualize what is going on is one of the most serious missed opportunities I observe. Leinwand, 2009, p.19 | Modeling can begin with young learners with basic addition, subtraction, multiplication, and division problems. Modeling can be extended to ratio, rate, percent, multi-step, and other complex problems in the upper grades. Utilizing modeling on a routine basis in early grades can lay an important foundation for later work, including the transition to algebra, by stressing patterns, generalizations, and how numbers relate to each other. |
Knowledge can be represented both linguistically and nonlinguistically. An increase in nonlinguistic representations allows students to better recall knowledge and has a strong impact on student achievement (Marzano, et. al., 2001, Section 5). In classic education research, Bruner (1961) identified three modes of learning: enactive (manipulating concrete objects), iconic (pictures or diagrams), and symbolic (formal equation). The iconic stage, using pictures and diagrams, is an important bridge to abstracting mathematical ideas using the symbols of an equation. Research has also validated that students need to see an idea in multiple representations in order to identify and represent the common core (Dienes, undated). For word problems involving the operation of addition, students need to experience several types of problems to generalize that when two parts are joined they result in a total or a quantity that represents the whole. Whether the items are bears, balloons, or cookies no longer matters as the students see the core idea of two subsets becoming one set. Dienes discovered that this abstraction is only an idea; therefore it is hard to represent. Diagrams can capture the similarity students notice in addition/joining problems where both addends are known and the total or whole is the unknown. Diagrams will also be useful for missing addend situations. Like Bruner, Dienes saw diagrams as an important bridge to abstracting and formalizing mathematical ideas.
Along with Bruner and Dienes, Skemp (1993) identified the critical middle step in moving from a real-life situation to the abstractness of an equation. While students need to experience many real-life situations they will get bogged down with the "noise" of the problem such as names, locations, kinds of objects, and other details. It is the teacher's role to help students sort through the noise to capture what matters most for solving the problem. A diagram can help students capture the numerical information in a problem, and as importantly, the relationship between the numbers, e.g. Do we know both the parts, or just one of the parts and the whole? Are the parts similar in size, or is one larger than the other? Once students are comfortable with one kind of diagram, they can think about how to relate it to a new situation. A student who has become proficient with using a part-part-whole bar model diagram when the total or whole is unknown, (as in the collecting cans problem in Mr. Alexander's class), cannot only use the model in other part-part-whole situations, but can use it in new situations, for example, a missing addend situation. Given several missing addend situations, students may eventually generalize that these will be subtractive situations, solvable by either a subtraction or adding on equation.
The work of Bruner, Dienes and Skemp informed the development of computation diagrams in some elementary mathematics curriculum materials in the United States. Interestingly, it also informed the development of curriculum in Singapore, as they developed the "Thinking Schools, Thinking Nation" era of reforming their educational model and instructional strategies (Singapore Ministry of Education, 1997). The bar model is a critical part of "Singapore Math." It is used and extended across multiple grades to capture the relationships within mathematical problems. Singapore has typically scored near the top of the world on international assessments, a possible indicator of the strong impact of including the visual diagram step to represent and solve mathematical problems.
What is modeling word problems?
Models at any level can vary from simple to complex, realistic to representational. Young students often solve beginning word problems, acting them out, and modeling them with the real objects of the problem situation, e.g. teddy bears or toy cars. Over time they expand to using representational drawings, initially drawing pictures that realistically portray the items in a problem, and progressing to multi-purpose representations such as circles or tally marks. After many concrete experiences with real-life word problems involving joining and separating, or multiplying and dividing objects, teachers can transition students to inverted-V and bar model drawings which are multi-purpose graphic organizers tied to particular types of word problems.
Modeling Basic Number Relationships
Simple diagrams, sometimes known as fact triangles, math mountains, situation diagrams, or representational diagrams have appeared sporadically in some curriculum materials. But students' problem solving and relational thinking abilities would benefit by making more routine use of these diagrams and models.
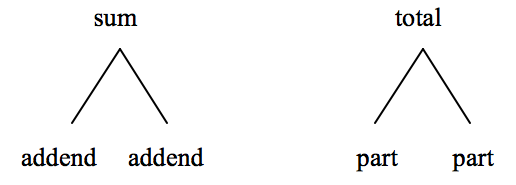
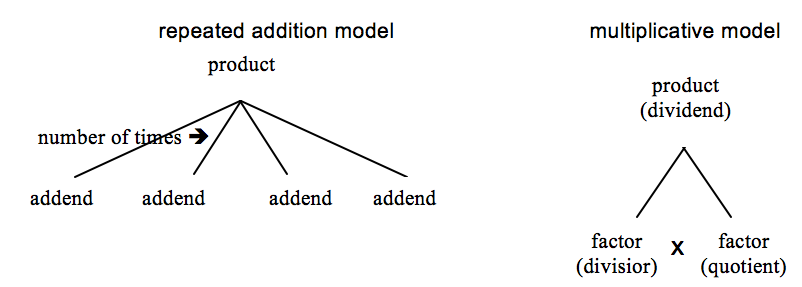
Young children can begin to see number relationships that exist within a fact family through the use of a model from which they derive equations. An inverted-V is one simple model that helps students see the addition/subtraction relationships in a fact family, and can be used with word problems requiring simple joining and separating. The inverted-V model can be adapted for multiplication and division fact families. For addition, students might think about the relationships among the numbers in the inverted-V in formal terms, addend and sum, or in simpler terms, part and total, as indicated in the diagrams below.
A specific example for a given sum of 10 would be the following, depending on which element of the problem is unknown.
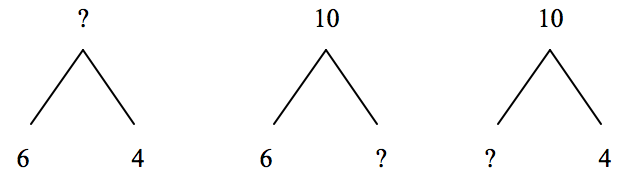
6 + 4 = ? 6 + ? = 10 ? + 4 = 1
4 + 6 = ? 10 - 6 = ? 10 - 4 = ?
While often used with fact families, and the learning of basic facts, inverted-V diagrams can also work well with solving word problems. Students need to think about what they know and don't know in a word problem - are both the parts known, or just one of them? By placing the known quantities correctly into the inverted-V diagram, students are more likely to determine a useful equation for solving the problem, and see the result as reasonable for the situation. For example, consider the following problem:
Zachary had 10 train cars. Zachary gave 3 train cars to his brother. How many train cars does Zachary have now?
Students should determine they know how many Zachary started with (total or whole), and how many he gave away (part of the total). So, they need to find out how many are left (other part of the total). The following inverted-V diagram represents the relationships among the numbers of this problem:
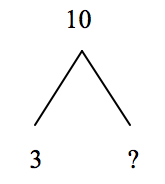
3 + ? = 10 or 10 - 3 = ?, so Zachary had 7 train cars left.
As students move on to multiplication and division, the inverted-V model can still be utilized in either the repeated addition or multiplicative mode. Division situations do not require a new model; division is approached as the inverse of multiplication or a situation when one of the factors is unknown.
Again, the inverted-V diagram can be useful in solving multiplication and division word problems. For example, consider the following problem:
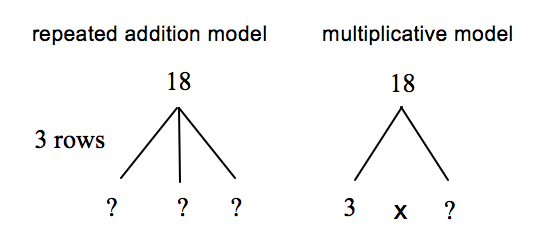
Phong planted 18 tomato plants in 3 rows. If each row had the same number of plants, how many plants were in each row?
Students can see that they know the product and the number OF rows. The number IN A row is unknown. Either diagram below may help solve this problem, convincing students that 6 in a row is a reasonable answer.
While the inverted-V diagram can be extended to multi-digit numbers, it has typically been used with problems involving basic fact families. Increasing the use of the inverted-V model diagram should heighten the relationship among numbers in a fact family making it a useful, quick visual for solving simple word problems with the added benefit of using and increasing the retention of basic facts.
Models and Problem Types for Computation
As children move to multi-digit work, teachers can transition students to bar model drawings, quick sketches that help students see the relationships among the important numbers in a word problem and identify what is known and unknown in a situation.
Although there are a number of ways that word problems can be distinguished from each other, one of the most useful ways of classifying them focuses on the types of action or relationships described in the problems. This classification corresponds to the way that children think about problems. Carpenter, et.al, 1999, p. 7 | Bar models work well with recognition of problem types. There are four basic types for addition and subtraction word problems: 1) join (addition), 2) separate (subtraction), 3) part-part-whole, and 4) comparison (Carpenter, Fennema, Franke, Levi, & Empson, 1999, Chapter 2). Within each of the first three types, either the sum (whole or total), or one of the addends (parts) can be the unknown. For a comparison problem, either the larger quantity, smaller quantity, or the difference can be unknown.
By introducing students to bar models a teacher has an important visual to facilitate student thinking about the mathematical relationships among the numbers of a given word problem. |
With bar models the relationships among numbers in all these types of problems becomes more transparent, and helps bridge student thinking from work with manipulatives and drawing pictures to the symbolic stage of writing an equation for a situation. With routine use of diagrams and well-facilitated discussions by teachers, student will begin to make sense of the parts of a word problem and how the parts relate to each other.
Part-Part-Whole Problems. Part-Part-Whole problems are useful with word problems that are about sets of things, e.g. collections. They are typically more static situations involving two or more subsets of a whole set. Consider the problem,
Cole has 11 red blocks and 16 blue blocks. How many blocks does Cole have in all?
Students may construct a simple rectangle with two parts to indicate the two sets of blocks that are known (parts/addends). It is not important to have the parts of the rectangle precisely proportional to the numbers in the problem, but some attention to their relative size can aid in solving the problem. The unknown in this problem is how many there are altogether (whole/total/sum), indicated by a bracket (or an inverted-V) above the bar, indicating the total of the 2 sets of blocks. The first bar model below reflects the information in the problem about Cole's blocks.
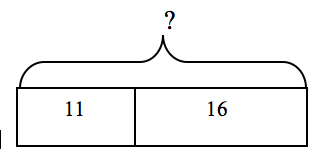
11 + 16 = ? so Cole has 27 blocks in all.
A similar model would work for a problem where the whole amount is known, but one of the parts (a missing addend) is the unknown. For example:
Cole had 238 blocks. 100 of them were yellow. If all Cole's blocks are either blue or yellow, how many were blue?
The following bar model would be useful in solving this problem.
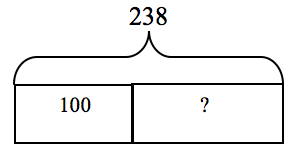
100 + ? = 238 or 238 - 100 = ? so Cole has 138 blue blocks.
The answer has to be a bit more than 100 because 100 + 100 is 200 but the total here is 238 so the blue blocks have to be a bit more than 100.
The part-part-whole bar model can easily be expanded to large numbers, and other number types such as fractions and decimals. Consider the problem:
Leticia read 7 ½ books for the read-a-thon.She wants to read 12 books in all. How many more books does she have to read?
The first diagram below reflects this problem. Any word problem that can be thought of as parts and wholes is responsive to bar modeling diagrams. If a problem has multiple addends, students just draw enough parts in the bar to reflect the number of addends or parts, and indicate whether one of the parts, or the whole/sum, is the unknown, as shown in the second figure below.
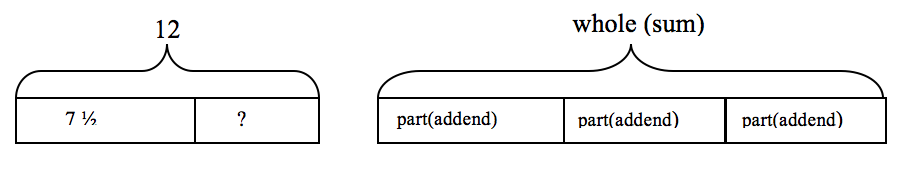
12 - 7 ½ = ? or 7 ½ + ? = 12 so Leticia needs to read 4 ½ more books.
Join (Addition) and Separate (Subtraction) Problems.
Students who struggle with deciding whether they need to add or subtract, or later to multiply or divide, find the organizing potential of the bar model incredibly helpful. Leinwand, 2009, p. 23 | Some addition and subtraction problems have a stated action - something is added to or separated from a beginning quantity. While often considered a different problem type from the more static part-part-whole problems, join and separate problems can also use a rectangular bar model to represent the quantities involved. Students need to think about whether something is being joined (added) to an amount, or if something is being separated (subtracted). In addition the bracket indicates the total that will result when the additive action is completed. In whole number subtraction, a starting quantity is indicated by the bracket. It is decreased by an amount that is separated or taken away, resulting in a number that indicates what is remaining. |
Consider this joining problem:
Maria had $20. She got $11 more dollars for babysitting. How much money does she have now?
Students can identify that the starting amount of $20 is one of the parts, $11 is another part (the additive amount), and the unknown is the sum/whole amount, or how much money she has now. The first diagram below helps represent this problem.
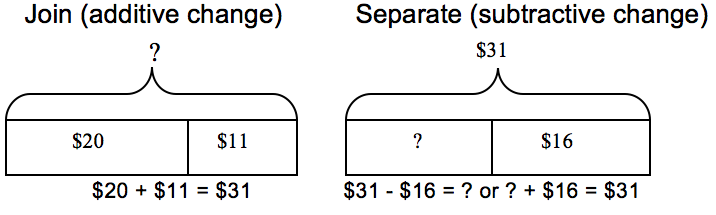
Consider the related subtractive situation:
Maria had $31. She spent some of her money on a new CD. Maria now has $16 left.
The second diagram above represents this situation. Students could use the model to help them identify that the total or sum is now $31, one of the parts (the subtractive change) is unknown, so the other part is the $16 she has left.
Comparison Problems. Comparison problems have typically been seen as difficult for children. This may partially be due to an emphasis on subtraction as developed in word problems that involve "take away" situations rather than finding the "difference" between two numbers. Interestingly, studies in countries that frequently use bar models have determined that students do not find comparison problems to be much more difficult than part-part-whole problems (Yeap, 2010, pp. 88-89).
A double bar model can help make comparison problems less mysterious. Basically, comparison problems involve two quantities (either one quantity is greater than the other one, or they are equal), and a difference between the quantities. Two bars, one representing each quantity, can be drawn with the difference being represented by the dotted area added onto the lesser amount. For example, given the problem:
Tameka rode on 26 county fair rides. Her friend, Jackson, rode on 19 rides. How many more rides did Tameka ride on than Jackson?
Students might generate the comparison bars diagram shown below, where the greater quantity, 26, is the longer bar. The dotted section indicates the difference between Jackson's and Tameka's quantities, or how much more Tameka had than Jackson, or how many more rides Jackson would have had to have ridden to have the same number of rides as Tameka.
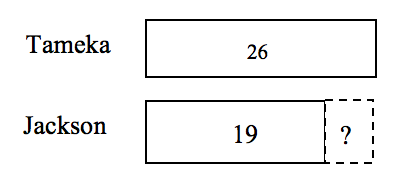
26 - 19 = ? or 19 + ? = 26; the difference is 7 so Tameka rode 7 more rides.
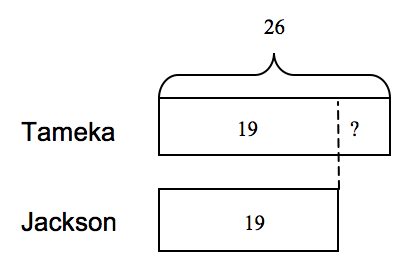
Comparison problems express several differently worded relationships. If Tameka rode 7 more rides than Jackson, Jackson rode 7 fewer rides than Tameka. Variations of the double bar model diagram can make differently worded relationships more visual for students. It is often helpful for students to recognize that at some point both quantities have the same amount, as shown in the model below by the dotted line draw up from the end of the rectangle representing the lesser quantity. But one of the quantities has more than that, as indicated by the area to the right of the dotted line in the longer bar. The difference between the quantities can be determined by subtracting 19 from 26, or adding up from 19 to 26 and getting 7, meaning 26 is 7 more than 19 or 19 is 7 less than 26.
Comparison word problems are especially problematic for English Learners as the question can be asked several ways. Modifying the comparison bars may make the questions more transparent. Some variations in asking questions about the two quantities of rides that Tameka and Jackson rode might be:
- How many more rides did Tameka ride than Jackson?
- How many fewer rides did Jackson go on than Tameka?
- How many more rides would Jackson have had to ride to have ridden the same number of rides as Tameka?
- How many fewer rides would Tameka have had to ride to have ridden the same number of rides as Jackson?
Comparisons may also be multiplicative. Consider the problem:
Juan has 36 CDs in his collection. This is 3 times the amount of CDs that his brother, Marcos, has. How many CDs does Marcos have?
In this situation, students would construct a bar model, shown below on the left, with 3 parts. Students could divide the 36 into 3 equal groups to show the amount that is to be taken 3 times to create 3 times as many CDs for Juan.
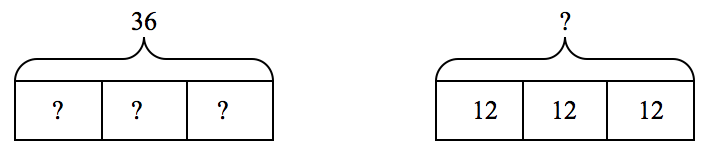
36 ¸ 3 = ? or 3 x ? = 36 12 + 12 + 12 = ? (or 3 x 12 = ?)
so Marcos has 12 CDs. so Juan has 36 CDs.
A similar model can be used if the greater quantity is unknown, but the lesser quantity, and the multiplicative relationship are both known. If the problem was:
Juan has some CDs. He has 3 times as many CDs as Marcos who has 12 CDs. How many CDs does Juan have?
As seen in the diagram above on the right, students could put 12 in a box to show the number of CDs Marcos has; then duplicate that 3 times to sow that Juan has 3 times as many CDs. Then the total number that Juan has would be the sum of those 3 parts.
Multiplication and Division Problems. The same model used for multiplicative comparisons will also work for basic multiplication word problems, beginning with single digit multipliers. Consider the problem:
Alana had 6 packages of gum. Each package holds 12 pieces of gum. How many pieces of gum does Alana have in all?
The following bar model uses a repeated addition view of multiplication to visualize the problem.
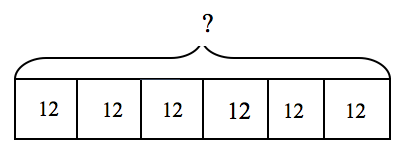
12 + 12 + 12 + 12 + 12 + 12 = 72 (or 6 x 12 = 72)
so Alana has 72 pieces of gum.
As students move into multi-digit multipliers, they can use a model that incorporates an ellipsis to streamline the bar model. For example:
Sam runs 32 km a day during April to get ready for a race. If Sam runs every day of the month, how many total kilometers did he run in April?
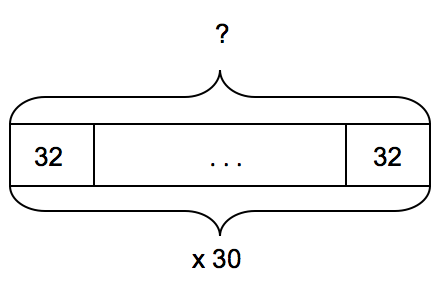
30 x 32 km = 30 x 30 km + 30 x 2 km = 960 km
Sam ran 960 km during the 30 days of April.
Since division is the inverse of multiplication, division word problems will utilize the multiplicative bar model where the product (dividend) is known, but one of the factors (divisor or quotient) is the unknown.
Problems Involving Rates, Fractions, Percent & Multiple Steps. As students progress through the upper grades, they can apply new concepts and multi-step word problems to bar model drawings. Skemp (1993) identified the usefulness of relational thinking as critical to mathematical development. A student should be able to extend their thinking based on models they used earlier, by relating and adapting what they know to new situations.
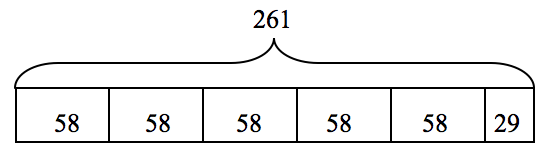
Consider this rate and distance problem:
Phong traveled 261 miles to see her grandmother. She averaged 58 mph. How long did it take her to get to her grandmother's house?
The following model builds off of the part-part-whole model using a repeated addition format for multiplication and division. It assumes that students have experience with using the model for division problems whose quotients are not just whole numbers. As they build up to (or divide) the total of 261 miles, they calculate that five 58's will represent 5 hours of travel, and the remaining 29 miles would be represented by a half box, so the solution is it would take Phong 5½ hours of driving time to get to her grandmother's house.
Even a more complex rate problem can be captured with a combination of similar models. Consider this problem:
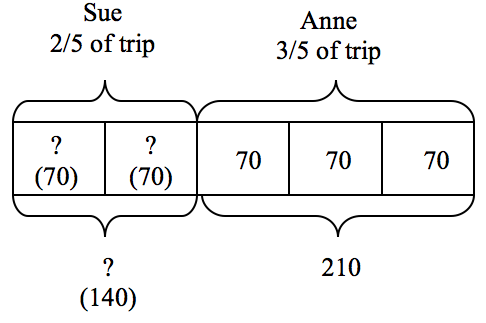
Sue and her friend Anne took a trip together. Sue drove the first 2/5 of the trip and Anne drove 210 miles for the last 3/5 of the trip. Sue averaged 60 mph and Anne averaged 70 mph. How long did the trip take them?
There are several ways students might combine or modify a basic bar model. One solution might be the following, where the first unknown is how many miles Sue drove. A bar divided into fifths represents how to calculate the miles Sue drove. Since we know that the 210 miles Anne drove is 3/5 of the total trip, each one of Anne's boxes, each representing 1/5 of the trip, is 70 miles. Therefore, Sue drove two 70 mile parts, or 140 miles, to equal 2/5 of the total trip.
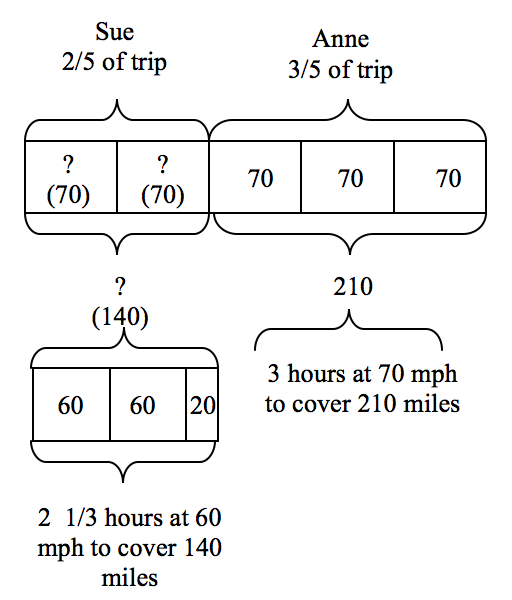
The diagram now needs to be extended to show how to calculate the number of hours. Anne's 210 mile segment, divided by her 70 mph rate will take 3 hours, as recorded on the following extension of the diagram. Sue's distance of 140 miles now needs to be divided into 60 mph segments to determine her driving time of 2 1/3 hours. So, the total trip of 350 miles would take 5 1/3 hours of driving time, considering the two driving rates.
Certainly, a foundation of using simple bar model drawings needs to be well developed in early grades for students to extend diagrams with understanding in later grades. The Sue and Anne rate-time-distance problem would not be the place to begin using bar models! But, by building on work in earlier grades with models, this extended model makes the mathematics of this complex problem more transparent, and helps students think through the steps.
Consider a simpler multi-step problem:
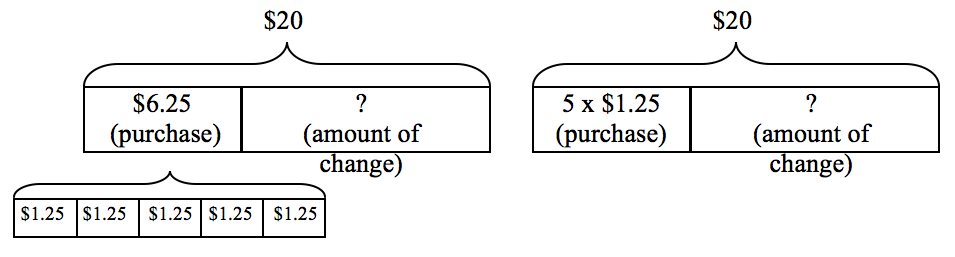
Roberto purchased 5 sports drinks at $1.25 each. Roberto gave the cashier $20. How much change did he get back?
Again, there may be student variations when they begin to extend the use of diagrams in multi-step or more complex problems. Some students might use two diagrams at once, as show below on the left. Others may indicate computation within one diagram, as shown in the diagram on the right.
With routine experience with bar modeling, students can extend the use of the models to problems involving relationships that can be expressed with variables. Consider this simple problem that could be represented algebraically:
Callan and Avrielle collected a total of 190 bugs for a science project. Callan collected 10 more bugs than Avrielle. How many bugs did Callan collect?
Let n equal the number of bugs Avrielle collected, and n + 10 equal the number of bugs Callan collected. The following model might be created by students:
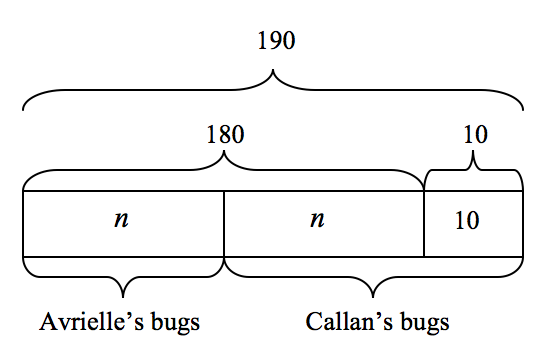
Since n + n = 180 (or 2n = 180), n = 90. Therefore, Callan collected 90 + 10 or 100 bugs and Avrielle collected 90 bugs for a total of 190 bugs collected together.
In using the model method, students have to translate information and relationships in words into visual representations, which are the models. They also have to manipulate and transform the visual representations to generate information that is useful in solving given problems. In using algebraic methods, students similarly engage in these processes . . . The model method provides a platform where students engage in such algebraic processes using the less abstract visual medium. Yaep, 2010. p.162 | Understanding the structure of a word problem involves knowing how the mathematical information in a given word problem is related, and how to extract the components needed for solving the problem. Bar model drawings can help students become more proficient at identifying the variables involved in a problem as well as the relationship(s) between them. This ability to focus on the relationships among the numbers in a given problem, and to recognize the mathematical structure as a particular type of problem, is part of relational thinking - a critical skill for success in algebra. Building inverted-V and bar models into pre-algebraic work in grades K-7 can make students more powerfully ready for the formal study of algebra. |
Planning and Instruction
How do I intentionally plan for and use modeling?
If modeling is not a way you learned to identify the important information and numerical relationships in word problems, you may want to review some of the resources on problem types (see Carpenter's book in References and Resources section below), or bar modeling (see books by Forsten, Walker, or Yeap in the References and Resources section below). You may also want to practice the different types of models. Decide which are most accessible for your students, and start with introducing one model at a time, helping students determine what is unknown in the problem, and where that unknown and the other numerical information should be placed in the bar model. A question mark, box, or a variable can be used for the unknown. As students become comfortable with that model, introduce, and compare and contrast a second model with the known model.
You might introduce bar model drawings, or inverted-V diagrams, when there is a unit in your curriculum that contains several word problems. If word problems are sporadic in your curriculum, you might introduce a "Word-Problem-of-the-Day" format where students solve a problem, or cluster of related problems, each day.
To emphasize model drawings, you might have students take a set of problems, and classify them as to which model would help them solve the problem, or do a matching activity between word problems and model drawings. Ask students to explain why a particular equation matches a model and would be useful in finding the solution. Another activity is to present a bar model with some numerical information and an unknown. Then ask students to write a word problem that could logically be solved using that model. Ask students to explain why the word problem created matches a diagram well. As students use models for solving word problems, they may generate different equations to solve a problem even though their models are the same. Plan for class discussions where students may discuss why there can be different equations from the same bar model.
Summary
Several studies have shown that students who can visualize a word problem through modeling increase their problem solving ability and accuracy. This has been particularly documented in Singapore and other high performing countries where bar modeling is used extensively across grades. Students are more likely to solve problems correctly when they incorporate bar model drawings. On difficult problems, students who have been able to easily generate equations with simple problems often find that bar model drawings are especially helpful in increasing accuracy as problems increase in difficulty or involve new concepts (Yeap, 2010, pp. 87-89).
TALK: Reflection and Discussion
- Are there particular types of word problems that your students solve more easily than others? What characterizes these problems?
- Identify some basic facts with which your students struggle. How could you incorporate those facts into word problems, and how might the use of the inverted-V model help?
- How do bar model drawings help extract and represent the mathematical components and numerical relationships of a word problem?
- With which type of word problems would you begin to show your students the use of bar model drawings?
DO: Action Plans
- Select several story problems from your curriculum, MCA sample test items, or the Forsten, Walker, or Yeap resources on bar model drawing. Practice creating a bar model for several problems. Compare your models with others in your grade level, team, or PLC group. Practice until you feel comfortable with various model drawings.
- Investigate the types of multiplication and division problems, and how bar models can be used with different types such as measurement and partitive division, arrays, equal groups, rates. The Carpenter resource may be helpful.
- Select some problems from your curriculum that are of a similar type. Which bar model would be helpful in solving this type of problem? Practice using the model yourself with several problems of this type. How will you introduce the model to your students?
- Identify some basic facts with which your students struggle. Craft some rich word problems utilizing these fact families. Introduce the inverted-V diagrams with the word problems to make sense of the information in the word problem, and discuss strategies for solving the problems.
- Initiate a "Word-Problem-of-the-Day". Students might want to keep problem solving notebooks. Begin with problems of a particular type, and show students how to use a bar model to represent the information in a problem. Cluster several problems of a given type during the week. What improvements do you see in student selection of appropriate equations, accuracy of solutions, and ability to estimate or justify their answers as they increase the use of bar models to solve the word problems? A quick way to disseminate the "Word-Problem-of-the-Day" is to duplicate the problem on each label on a sheet of address labels. Students can just peel off the daily problem, add it to their problem solving notebook or a sheet of paper and solve away.
- When your district is doing a curriculum materials review, advocate to include a criteria that requires the use of visual models in helping students make sense of mathematical problems.
- Watch some of the videos of students using models on the Powerful Practices CD (see Carpenter and Romberg in References and Resources Section).
References and Resources
Bruner, J. S. (1961). The act of discovery. Harvard Educational Review, 31, pp. 21-32, in Yeap, Ban Har. (2010). Bar modeling: A problem solving tool. Singapore: Marshall Cavendish Education.
Carpenter, T. P., Fennema, E., Franke, M. L., Levi, L. & Empson, S. B. (1999). Children's mathematics: Cognitively guided instruction. Portsmouth, NH: Heinemann. (Book and CD)
Carpenter, T. P. & Romberg. T. A. (2004). Modeling, generalization, and justification in mathematics cases, in Powerful practices in mathematics & science. Madison, WI: National Center for Improving Student Learning and Achievement in Mathematics and Science. www.wcer.wisc.edu/ncisla (Booklet and CD)
Dienes, Z. (undated). Zoltan Dienes' six-state theory of learning mathematics. Retrieved from http://www.zoltandienes.com
Forsten, C. (2009). Step-by-step model drawing: Solving math problems the Singapore way. Peterborough, NH: SDE: Crystal Spring Books. http://www.crystalspringsbooks.com
Hoven, J. & Garelick, B. (2007). Singapore math: Simple or complex? Educational Leadership, 65 (3), 28-31.
Leinwand, S. (2009). Accessible mathematics: 10 instructional shifts that raise student achievement. Portsmouth, NH: Heinemann.
Marzano, R. J., Norford, J. S., Paynter, D. E., Pickering, D. J., & Gaddy, B. B. (2001). A handbook for classroom instruction that works. Alexandria, VA: Association for Supervision and Curriculum Development.
Singapore Ministry of Education. (1997). Retrieved http://moe.gov.sg
Skemp, R. R. (January, 1993). "Theoretical foundations of problem solving: A position paper." University of Warwick. Retrieved from http://www.grahamtall.co.uk/skemp/sail/theops.html
Walker, L. (2010). Model drawing for challenging word problems: Finding solutions the Singapore way. Peterborough, NH: SDE: Crystal Spring Books. http://www.crystalspringsbooks.com
Yeap, B. H. (2010). Bar modeling: A problem solving tool. Singapore: Marshall Cavendish Education. http://www.singaporemath.com