6.1.1B Equivalence & Representations
Understand that percent represents parts out of 100 and ratios to 100.
For example: 75% corresponds to the ratio 75 to 100, which is equivalent to the ratio 3 to 4.
Determine equivalences among fractions, decimals and percents; select among these representations to solve problems.
For example: If a woman making $25 an hour gets a 10% raise, she will make an additional $2.50 an hour, because $2.50 is $\frac{1}{10}$ or 10% of $25.
Convert between equivalent representations of positive rational numbers.
For example: Express $\frac{10}{7}$ as $\frac{7+3}{7}=\frac{7}{7}+\frac{3}{7}=1\frac{3}{7}$.
Overview
Relationships of equivalence with different forms of rational numbers can be illustrated in a variety of representations. Students use fractions, decimals, and percents to describe equivalent positive rational numbers. Clement (2004) suggests five different kinds of representations for teaching students the concepts of fractions, decimals and percents. These five representations are pictures, manipulatives, spoken language, written symbols, and relevant situations. Conceptual understanding of these equivalencies is developed as students describe these rational numbers in concrete representational forms (fraction strips, Cuisenaire rods, pattern blocks, etc.); visual representational forms (grids, diagrams, pictures, etc.); and abstract symbolic form. Using these same structures, students expand their understanding of equivalence with rational numbers to making comparisons between them. Students' learning experiences with these different forms of representation guide them in identifying and selecting appropriate forms for making comparisons and conversions in a particular situation.
The skills of prime factorization, least common multiple, and greatest common factor become tools for students in their formation of equivalent fractional numbers. Student understanding of representing whole numbers as a product of factors with exponents is aided by their previous work with whole numbers, multiples, factors and exponents.
All Standard Benchmarks
- 6.1.1.1 Locate positive rational numbers on a number line and plot pairs of positive rational numbers on a coordinate grid.
- 6.1.1.2 Compare positive rational numbers represented in various forms. Use the symbols <, =, and >.
- 6.1.1.3 Understand that percent represents parts out of 100 and ratios to 100.
- 6.1.1.4 Determine equivalences among fractions, decimals, and percents: select among these representations to solve problems.
- 6.1.1.5 Factor whole numbers; express a whole number as a product of prime factors with exponents.
- 6.1.1.6 Determine greatest common factors and least common multiples. Use common factors and common multiples to calculate with fractions and find equivalent fractions.
- 6.1.1.7 Convert between equivalent representations of positive rational numbers.
Benchmark Group B
- 6.1.1.3 Understand that percent represents parts out of 100 and ratios to 100.
- 6.1.1.4 Determine equivalences among fractions, decimals, and percents; select among these representations to solve problems.
- 6.1.1.7 Convert between equivalent representations of positive rational numbers.
What students should know and be able to do [at a mastery level] related to these benchmarks.
- Demonstrate knowledge of percent as representing part per 100 or ratios to 100;
- Understand that 100% is equivalent to 1;
- Determine equivalencies between fractions and decimals, decimals and percents, and fractions and percents;
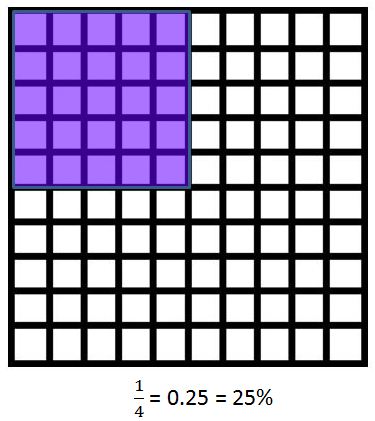
- Recognize common benchmarks; e.g., $\frac{1}{4}$ = 0.25 = 25%
- Understand that percents must be converted to fractions or decimals in order to multiply or divide;
- Choose among representations of rational numbers (fractions, decimals, and percents) to solve problems.
Work from previous grades that supports this new learning includes:
Recognize and generate equivalent decimals, fractions, mixed numbers and improper fractions in various contexts.
- Divide multi-digit numbers using efficient and generalizable procedures, based on knowledge of place value, including standard algorithms. Recognize that quotients can be represented in a variety of ways, including a whole number with a remainder, a fraction or mixed number, or a decimal. Divide numerator by denominator to produce a decimal.
- Estimate solutions to arithmetic problems in order to access the reasonableness of results.
- Visualize or use area models to determine equivalency
NCTM Standards
Understand numbers, ways of representing numbers, relationships among numbers, and number systems:
- work flexibly with fractions, decimals, and percents to solve problems;
- compare and order fractions, decimals, and percents efficiently and find their approximate locations on a number line;
- develop meaning for percents greater than 100 and less than 1;
- understand and use ratios and proportions to represent quantitative relationships;
- use factors, multiples, prime factorization, and relatively prime numbers to solve problems.
Common Core State Standards
4NF (NUMBER AND OPERATIONS - FRACTIONS) Extend understanding of fraction equivalence and ordering.
- 4NF.7 Compare two decimals to hundredths by reasoning about their size. Recognize that comparisons are valid only when the two decimals refer to the same whole. Record the results of comparisons with the symbols >, =, or <, and justify the conclusions, e.g., by using a visual model.
4OA. (OPERATIONS AND ALGEBRAIC THINKING) Gain familiarity with factors and multiples.
- 4OA.4 Find all factor pairs for a whole number in the range 1-100. Recognize that a whole number is a multiple of each of its factors. Determine whether a given whole number in the range 1-100 is a multiple of a given one-digit number. Determine whether a given whole number in the range 1-100 is prime or composite.
5NBT (NUMBER AND OPERATIONS IN BASE TEN) Understand the place value system.
- 5NBT.3b Compare two decimals to thousandths based on meanings of the digits in each place, using >, =, and < symbols to record the results of comparisons.
6NS (NUMBER SYSTEM) Apply and extend previous understandings of multiplication and division to divide fractions by fractions.
- 6NS.4 Find the greatest common factor of two whole numbers less than or equal to 100 and the least common multiple of two whole numbers less than or equal to 12. Use the distributive property to express a sum of two whole numbers 1-100 with a common factor as a multiple of a sum of two whole numbers with no common factor.
- 6NS.6 Understand a rational number as a point on the number line. Extend number line diagrams and coordinate axes familiar from previous grades to represent points on the line and in the plane with negative number coordinates.
- Recognize opposite signs of numbers as indicating locations on opposite sides of 0 on the number line; recognize that the opposite of the opposite of a number is the number itself, e.g., -(-3) = 3, and that 0 is its own opposite.
- Understand signs of numbers in ordered pairs as indicating locations in quadrants of the coordinate plane; recognize that when two ordered pairs differ only by signs, the locations of the points are related by reflections across one or both axes.
- Find and position integers and other rational numbers on a horizontal or vertical number line diagram; find and position pairs of integers and other rational numbers on a coordinate plane.
- 6NS.7 Understand ordering and absolute value of rational numbers.
- 6NS.7.b Write, interpret, and explain statements of order for rational numbers in real-world contexts. For example, write -30C > -70C to express the fact that -30C is warmer than -70C.
6RP (RATIOS AND PROPORTIONAL RELATIONSHIPS) Understand ratio concepts and use ratio reasoning to solve problems.
- 6RP.3Use ratio and rate reasoning to solve real-world and mathematical problems, e.g., by reasoning about tables of equivalent ratios, tape diagrams, double number line diagrams, or equations.
- 6RP3.c Find a percent of a quantity as a rate per 100 (e.g., 30% of a quantity means 30/100 times the quantity); solve problems involving finding the whole, given a part and the percent.
Misconceptions
- Students may have difficulty dividing the numerator by the denominator to identify a decimal equivalency to be translated to a percent. Creating a percent from a decimal number requires students to understand the meaning of the percent symbol and the procedure of moving the decimal point two place values to the left of the current decimal point. Some students leave the decimal in its exact place while creating an equivalent percent from a decimal.
Example: 0.12 = 12% not .12% - When looking at a 100-grid containing $28\frac{1}{2}$ colored squares, students may not understand how to write $\frac{28.5}{100}$ as 0.285 since $\frac{1}{2}$ of $\frac{1}{100}$ is 0.005.
- Students may not recognize that, in a problem solving situation, they must change a percent into a fraction or decimal in order to work with it.
- Students may have difficulty understanding the value of fractions when comparing fractions with the same numerators and different denominators.
Example: $\frac{3}{5}$ is less than $\frac{3}{8}$ because 5 is less than 8. - Students may think that a number containing a "longer" portion (more digits) to the right of the decimal point is actually "greater" than a "shorter" number.
Example, 3.12345 is NOT greater than 3.2. - Students may assume that $4\frac{7}{4}$ is smaller than $5\frac{1}{4}$ because the whole unit, 4, is smaller than the 5. They often do not consider the improper portion of a mixed number.
- Students might not use benchmark numbers like 0, $\frac{1}{2}$, and 1 to compare fractions because their understanding reflects only part-whole situations and they do not think of the fractions as numbers.
- Students may think that multiplying the numerator and the denominator by the same number increases the value of the fraction.
- Students may write the percent as a fraction using the wrong denominator, or try to remove the decimal point when writing it over 100.
Example: a student may write $\frac{775}{100}$ instead of$\frac{77.5}{100}$. - When changing a decimal to a percent, students may only add the percent symbol without considering parts per hundred.
Example: 0.12 may be written as .12%.
Vignette
In the Classroom
In this vignette, Mr. Olson takes advantage of his students' interest watching TV to collect and represent data as fractions, decimals, and percents.
Teacher: "How many of you enjoy homework?"
(Audible groans are heard from all parts of the room.)
Teacher: Today we're going to try a different kind of homework assignment that you may find more exciting. Instead of giving you a worksheet to practice translating between fractions, decimals, and percents, I'm going to 'require' you to watch 30 minutes of television.
Teacher: Recently I've heard some of you complaining about how often commercials interrupt your favorite TV shows. Your homework is to collect some data to investigate whether your complaints are justified. Here's how it works. Tonight, you must watch 30 minutes of a program your family allows you to see. For 30 minutes, you need to keep track of whether you're watching a commercial or viewing an actual show. I want you to record data every minute, using the words either "Show" or "Commercial" to indicate what you're watching.
Student: Is it all right if I watch more than 30 minutes?
Teacher: Class, what do you think?
Student: You mean some people want to do more homework?
Student: I don't want to do more homework. I just want to watch a show that lasts an hour.
Teacher: I'm asking you to collect data for 30 minutes. You'll have to discuss how much TV you watch tonight with your family.
Student: What if you don't have a TV?
Teacher: Then I'll arrange for you to have some class time tomorrow for data collection. Let's talk about how we might organize our data collection. Any ideas?
Student: It would be easy to record the data in our notebook. We could number the lines 1-30 to show the minutes, and then write either "Show" or "Commercial" on each line
Teacher: Is this what you mean?
1.
2.
3.
4.
Student: Yes, only I'd number all the way to 30.
Teacher: Yes, that's one way to organize your data collection. Any other ideas?
Student: I was thinking about making two columns - one for "Show" and one for "Commercial." Then I would use tally marks to show what was happening each minute.
Teacher: Show me what that would look like.
Student: Maybe like this.
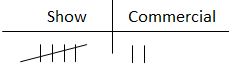
Teacher: That's another strategy that could be used. Just to be sure that you understand what the assignment is, we're going to watch 3 minutes of a TV and practice recording the data as either "Show" or "Commercial." Take a moment now to create a table or chart that you can use to collect 3 minutes of data, and then we'll practice.
(Class watches 3 minutes TV show; teacher models both strategies offered by students for data collection.)
Teacher: Are there any questions about tonight's homework assignment? If not, I look forward to seeing your data tomorrow.
The next day...
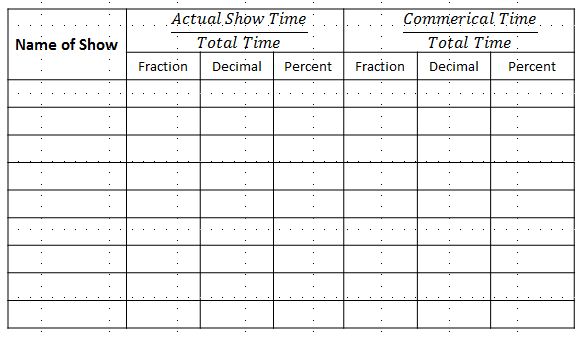
Mr. Olson has used the whiteboard at the front of the room to create a table for each student to record a summary of the data.
Teacher: Who got their homework done last night?
(Every hand is raised. Students are smiling and sharing their "homework" experiences.
Teacher: That's great! I'm curious to see your data. I've created a table on the white board where I'd like each of you to write the name of the show you watched, as well as the fraction, decimal, and percent that represent what part of the total time was spent on the actual show and what part was spent on commercials.
Note: This chart can provide an opportunity for students to see that the sum of the parts equals the whole; i.e., actual show time + commercials = total time. Students can also represent this data in a circle graph.
Resources
Teacher Notes
- Give students enough time and multiple opportunities to construct and process the concepts of representing and relating equivalents in their minds. Students learn "in a halting, back-and-forth sort of way." The process of learning is not just cumulative, but students are "disconnecting, connecting, and reorganizing" the knowledge they have acquired.
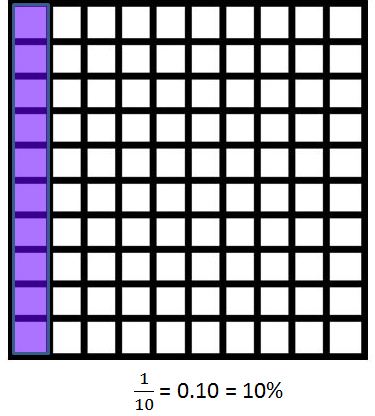
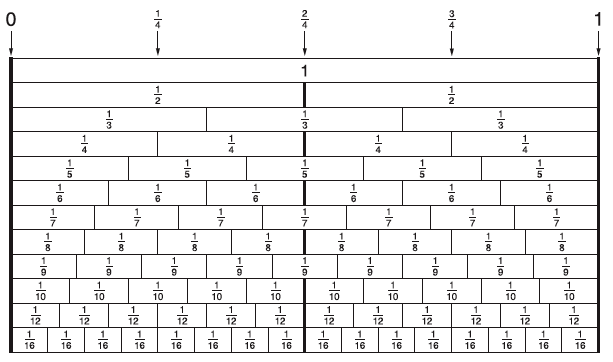
- Students have typically been taught about fractions, decimals, and percents in isolation. A conscious effort needs to be spent identifying numbers in a multitude of ways simultaneously to encourage flexible thinking. Students will benefit from using 100-grids as visual representations to connect fractions, decimals, and percent equivalencies.
- Students may have difficulty understanding decimal movement and placement with representing equivalent values from decimal to percent.
- Students may have difficulty understanding that the percent symbol implies a ratio of parts per hundred.
- By repeated exposure in multiple situations and representations, students should be developing a quick recall of common benchmark fractions and percents: halves, fourths, fifths, and tenths.
- Students have little difficulty writing a percent as a fraction. Writing fractions as percents is more challenging. Ask students how many percents are in one whole (100). Remind students that the denominator will always be 100. Also tell students that the number to the left of the percent symbol will always be the numerator.
- Students may not know when it is appropriate to use an equivalent fraction to write a fraction as a percent. While there is no error in writing the fraction as a decimal first, sometimes it is easier to just writing an equivalent fraction. Brainstorm some denominators that are easily rewritten as denominators of 100, such as 4, 5, 10, 20, 25, etc.
- Students have difficulty with percents greater than 100% or less than 1% (i.e., 150%, 0.015%). They want to quickly move the decimal point without thinking first. Reinforce the meaning behind moving the decimal point. Practice converting with greater and lesser percents when students are comfortable with percents between 1 and 100.
- 15% is 15 per one hundred or 0.15;
- 150% is 150 per one hundred or 1.5;
- 0.15% is 15 hundredths per one hundred or 0.0015;
- 0.015% is 15 thousandths per one hundred or 0.00015.
- Many struggle with the meaning of the percent symbol. Some may believe that 2.4% is the same as 2.4, while others think that 0.4 is the same as 4% Remind students that when the percent is given, for instance 40%, the percent symbol (%) means writing the number as a fraction with a denominator of 100. Therefore, 40% is $\frac{40}{100}$ (which can be simplified to $\frac{2}{5}$) = 0.40. Using the same idea, 2.4% is the same as $\frac{2.4}{100}= \frac{2.4}{100} \times \frac{10}{10}= 2.4 \times \frac{10}{100} \times 10 = \frac{24}{1000}$ (which can be simplified to $\frac{3}{125}$) = 0.024.
- Students may move the decimal point the wrong way, forget to place zeroes as placeholders, or move the decimal point too many places (especially when the percent is greater than 100). As a class, gather some helpful information for remembering how to convert decimals and percents.
- Students may struggle with the idea that three different forms of a number are useful. Have a classroom discussion where students brainstorm when to use fractions (construction, recipes), when to use decimals (money, science), and when to use percents (shopping, chance of rain).
Asks students to fill in missing portion of the following three; part, whole or percent.
Explore different representations for fractions including improper fractions, mixed numbers, decimals, and percentages. Additionally, there are length, area, region, and set models. Adjust numerators and denominators to see how they alter the representations and models. Use the table to keep track of interesting fractions.
In this lesson, students use real-world models to develop an understanding of fractions, decimals, unit rates, proportions, and problem solving.
Additional Instructional Resources
This article uses current research to assist with relating decimals, fractions and percents.
Allows practice with percentage, fraction to decimal, fraction to percentage, algebra, comparing fractions, reducing fractions, adding & subtracting fraction, multiplying & dividing fractions, rounding decimals, and improper fractions to mixed numbers.
per: for each, or for every. Example: If apples cost $1.99 per pound, then each pound of apples costs $1.99.
percent: per hundred, or out of 100. Example: "12% of sixth grade students are left-handed" means that out every 100 sixth grade students, 12 are left-handed.
rational number: any number that can be expressed in the form $\frac{a}{b}$ where a and b are integers and b≠0. A rational number can always be represented by either a terminating or a repeating decimal. Examples: $\frac{2}{3}$, 4 (which can be expressed as $\frac{4}{1}$); 2.25 (which can be expressed as $\frac{225}{100}$).
simplify (fraction): to express in simplest form, or lowest terms. The numerator and denominator of proper fractions in simplest form have no common factor other than 1. Improper fractions and mixed numbers are in simplest form when the fraction part is proper and in simplest form. Examples: The numerator and denominator of $\frac{4}{8}$ share the common factor 4, so must be rewritten as $\frac{1}{2}$ to be in simplest form; $\frac{10}{4}$ written in simplest form is $\frac{5}{2}$ or $2\frac{1}{2}$.
translate: change from one form of a number to another. Example: 50% can be translated to a decimal (0.5) or fraction ($\frac{1}{2}$).
Professional Learning Communities
Reflection - Critical Questions regarding the teaching and learning of these benchmarks:
How has the students' ability to conceptualize fractions, decimals, and percents been strengthened by today's lesson?
- What evidence exists to show that students understand percent as a ratio to 100?
- What evidence exists to show that students recognize fraction, decimal, and percent equivalencies?
- What everyday student experiences can be used as problem-solving opportunities?
- How was prior knowledge used to connect different representations of equivalencies?
Materials
Authors: Jenny K. Tsankova and Karmen Pjanic
The algorithm for multiplying proper fractions is often taught by gently leading students to notice patterns when finding part of a fractional part. An area-model approach will extend students' understanding.
Clement, L. L. (2004). A model for understanding, using, and connecting representations. Teaching Children Mathematics, 11 (2), 97 - 102.
Keeley, P., & Rose, C. (2006). Mathematics Curriculum Topic Study. Thousand Oaks, CA: Corwin Press.
Kilpatrick, J., Martin, W., & Schifter, D. (Eds.). (2003). A Research Companion to Principles and Standards for School Mathematics. Reston, VA: National Council of Teachers of Mathematics, Inc.
Mathematics Curriculum Framework. (2000). Malden, MA: Massachusetts Department of Education.
Minnesota's K-12 Mathematics Frameworks. (1998). St. Paul, MN: SciMathMN.
Mathematics Framework for the 2009 National Assessment of Educational Progress. (2009). Washington, D.C.: National Assessment Governing Board U.S. Department of Education.
Mathematics 6-8. GaDOE:Georgia Department of Education, n.d. Web. 29 Mar. 2011.
The Rational Number Project (choose RNP: Initial Fraction Ideas)Cramer, K., Behr, M., Post T., Lesh, R., (2009). The Rational Number Project (RNP) advocates teaching fractions using a model that emphasizes multiple representations and connections among different representations.
Behr, M. & Post, T. (1992). Teaching rational number and decimal concepts. In T. Post (Ed.), Teaching mathematics in grades K-8: Research-based methods (2nd ed.) (pp. 201-248). Boston: Allyn and Bacon.
Assessment
(DOK: Level 1)
1. What percent of the figure is shaded red?

Answer: 67%
(DOK Level 1)
2. Write $8\frac{11}{20}$ as a decimal.
Answer: 8.55
(DOK Level 2)
3. A baseball player's batting average is 0.625. Write this batting average as a fraction.
Answer: $\frac{5}{8}$
(DOK Level 2)
4. A 200-pound man lost 10 pounds. Which of the following represents the portion of body weight lost?
a. 0.10 b. $\frac{1}{200}$ c. 5% d. $\frac{1}{10}$
Answer: c
(DOK Level 2)
5. Ernest got a box of chocolates for his birthday. He has eaten 6 of the 20 pieces. What percent has he eaten?

Answer: 30%
(DOK: Level 3)
6. A species of cicada has a life cycle of 17 years. A parasite that harms the cicada has a life cycle of 4 years. If the last known encounter between these two was 1980. When can the cicada expect the next encounter with this parasite?
Answer: 2048
(DOK: Level 3)
7. Samantha had 300 beads.
30% were black
25% were red
15% were white
The rest of the beads were blue. How many beads were blue?
A. 25
B. 65
C. 90
D. 130
Answer: C
(DOK Level 4)
8. A sixth grade class was surveyed to find out whether like ice cream or cake better. The survey results are shown in the table below. Use the table to answer the following questions.
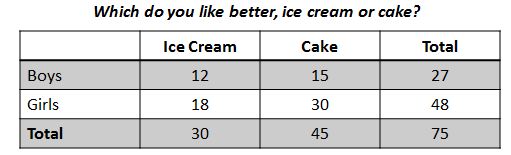
a) What fraction of the boys like cake better?
b) What percent of total students like cake better?
c) How does the fraction of boys that like cake better compare to the percent of total students that like cake better? Explain how you know.
Sample Answers:
a) $\frac{15}{27}=\frac{5}{9}$
b) $\frac{45}{75}=0.6=60%$
c) The fraction of boys that like cake better is less than the percent of total students. $\frac{5}{9}<60%$; I know because $\frac{5}{9}$ written as a decimal is 0.555...., which is the same as 55.5%. 55.5% is less than 60%.
Differentiation
Struggling Students
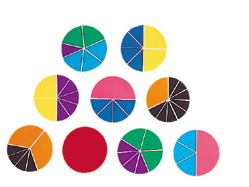
● Encourage student use of concrete and pictorial models to increase the understanding of abstract ideas. Fraction bars, fraction circles, area models, 10 by 10 grids, graph paper, number lines, coordinate grids, and Cuisenaire rods can be used to develop order relations among fractions, decimals, and percents.
Fraction Circles are commonly used for fraction instruction; however, these can also be used for decimal and percent concepts.
● Provide a fraction-stick chart that shows common equivalent fractions.
● Use concrete tools, such as percent circles, 100 grids, and meter sticks to aid in solving percent problems;
● Suggest websites containing interactive opportunities.
Example: Interactive Tutorial on Percentage. This applet contains a 100-grid, percent, and fraction interactive components.Given a partially completed chart of fractions, decimals, and percents, after students have completed the chart it could be used as a tool to assist them in daily work;
- Have students provide fraction, decimal and percent forms of the same number whether a specific problem requires it or not.
- Provide simpler problems when working with a more difficulty concept.
English Language Learners
- Connect the word "percent" to "per cent," as in cents or pennies;
- Post charts that shows how to convert among fractions, decimals, and percents;
- Pair students with others that have strong English language skills;
- Model alternate ways of solving problems; and, model more than once;
- Encourage parents to teach the same math skills in their native tongue to build a more cohesive understanding of concepts.
- Model the strategies needed to convert equivalencies for the student while coaching the student through the process. Repeat and reverse the roles.
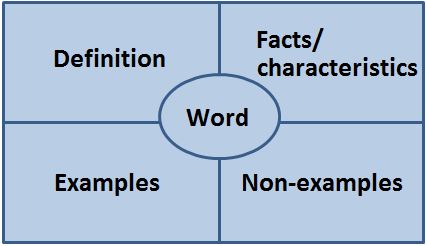
- Use graphic organizers such as the Frayer model shown below, for vocabulary development.
Extending the Learning
● Ask students to design their own problem using a circle graph; e.g., construct a circle graph that includes 4 or more fractions that are not equivalent with different denominators. Students can then share their problems and possible solutions.
● Pose problems involving percents greater than 100% or less than 1%.
● Ask students to predict whether increasing a number by 10%, then decreasing by 10% results in the original number and justify their answer.
Parents/Admin
Administrative/Peer Classroom Observation
Students are: (descriptive list) | Teachers are: (descriptive list) |
using concrete models and pictures to develop an understanding of equivalencies among fractions, decimals, and percents. | providing sufficient practice with the concrete before moving toward the abstract. |
recognizing equivalencies among fractions, decimals and percents; and then choosing the best representation of the solution from among the representations. | allowing students time to recognize equivalencies among different representations and choose among them to solve problems. |
converting among fractions, decimals, and percents. | posing questions that require students to convert among different representations. |
discussing and writing about the processes used to determine equivalencies and justifying their results. | actively listening, questioning, and providing encouragement for student talk regarding percents and equivalency relationships. |
becoming fluent at converting among the fractions, decimals, and percents of common benchmarks such as $\frac{1}{4}=0.25=25%$. | asking students to estimate solutions to problems by using common benchmarks. |
solving real-world problems that require conversion among fractions, decimals, and percents. | using students' everyday experiences as a source of rich problems. |
● Interactive Tutorial on Percentage This applet contains a 100-grid, percent, and fraction interactive components.
● Gifford, S., & Thaler S. (2003). Piece=Part=Portion. Berkley, CA: Tricycle Press. Print. Explains how in the language of mathematics, fractions, decimals and percents are three different ways of describing the same parts of things
● Percent Uses grids, fractions and decimals to identify percents. It also shares how to identify percent when 100 items are not available.